Help & Documentation
  • Home
  • Sign In
  • Contact Us
  • Home
  • Sign In
  • Contact Us

US T-Bond down to 175.7813

/Futures Technical Analysis - TD/US T-Bond down to 175.7813

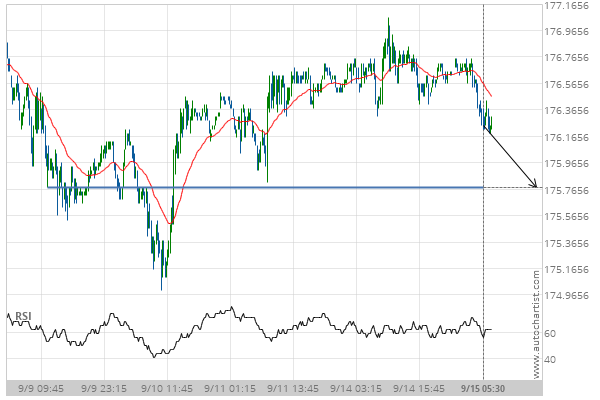
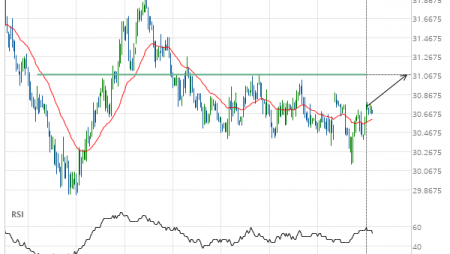
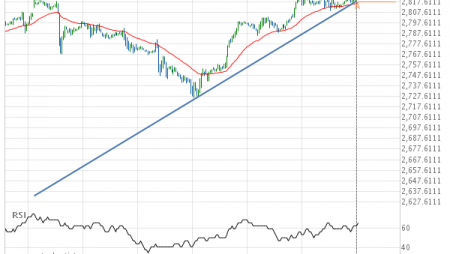
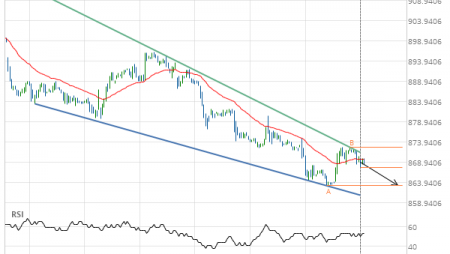
US T-Bond down to 175.7813

Posted on September 15, 2020 by Autochartist wrote in Futures Technical Analysis - TD.

Approaching Support level of 175.7813 identified at 15-Sep-2020 05:30 EDT

Tags: ZB
0 Likes
339 Views

You may also like

Gold Front Month down to 1706.2000
June 26, 2020
Lean Hogs up to 67.8475
September 16, 2019
Soybean Oil down to 46.6700
February 24, 2021

Comments are closed.

10 year T-Note down to 139.3438 Soybean Meal down to 308.7000

Futures Technical Analysis – TD

Light Sweet Crude Oil Front Month up to 67.9800

March 9, 2021 11:17 am | By Autochartist

Rising Wedge identified at 09-Mar-2021 05:00 EST. This pattern is... Read more →

Feeder Cattle Front Month down to 137.2250

March 9, 2021 11:17 am | By Autochartist

Channel Down identified at 08-Mar-2021 14:00 EST. This pattern is... Read more →

Soybean Oil up to 53.2300

March 9, 2021 11:17 am | By Autochartist

Channel Up identified at 09-Mar-2021 04:30 EST. This pattern is... Read more →

Silver Front Month up to 26.5600

March 9, 2021 11:17 am | By Autochartist

Approaching Resistance level of 26.5600 identified at 09-Mar-2021 04:00 EST Read more →

10 year T-Note up to 133.1644

March 9, 2021 11:17 am | By Autochartist

Falling Wedge has broken through the resistance line at 09-Mar-2021... Read more →

  • About Us
  • Privacy Policy
  • Disclaimer
  • Terms and Conditions
  • Get started for FREE
  • Contact Us
Copyright © 2020 Autochartist.com. All rights reserved.
This site uses cookies: Find out more.