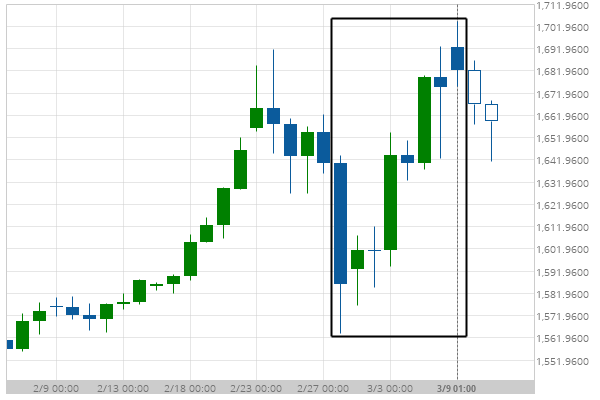
Gold Front Month excessive bearish movement Posted on March 11, 2020 by Autochartist wrote in Futures Statistical Analysis - TD. Gold Front Month experienced a 6.05% bullish movement in the last 10 days. Tags: Big Movement, GC 0 Likes 763 Views You may also like Light Sweet Crude Oil Front Month excessive bearish movement December 22, 2020 KC HRW Wheat excessive bearish movement February 28, 2019 Soybean Meal excessive bearish movement September 11, 2020 Comments are closed.