Help & Documentation
  • Home
  • Sign In
  • Contact Us
  • Home
  • Sign In
  • Contact Us

GBP/JPY up to 149.5090

/Forex Technical Analysis - TD/GBP/JPY up to 149.5090

GBP/JPY up to 149.5090

Posted on October 10, 2018 by admin wrote in Forex Technical Analysis - TD.

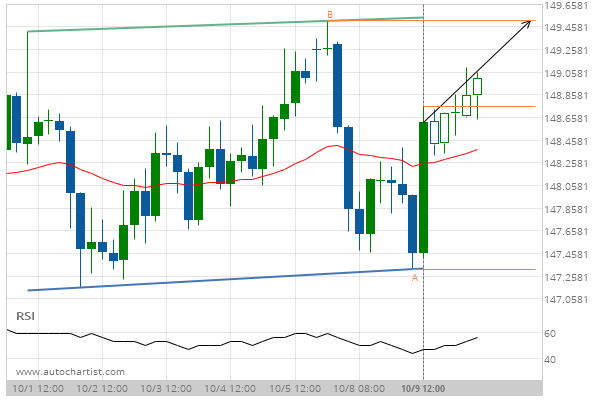
Rectangle identified at 09-Oct-2018 12:00 EDT. This pattern is still in the process of forming. Possible bullish price movement towards the resistance 149.5090 within the next 2 days.

Tags: GBPJPY
0 Likes
145 Views

You may also like

USD/JPY down to 112.6570
November 28, 2018
AUD/USD up to 0.7177
January 17, 2019
GBP/JPY up to 150.0334
October 1, 2018

Comments are closed.

NZD/USD up to 0.6496 EUR/CHF up to 1.1450

Forex Technical Analysis – TD

USD/CAD down to 1.3273

February 15, 2019 11:15 am | By admin

Approaching Support level of 1.3273 identified at 15-Feb-2019 05:00 EST Read more →

EUR/USD down to 1.1248

February 15, 2019 11:15 am | By admin

Falling Wedge identified at 14-Feb-2019 21:00 EST. This pattern is... Read more →

NZD/USD up to 0.6856

February 15, 2019 11:15 am | By admin

Ascending Triangle identified at 15-Feb-2019 00:00 EST. This pattern is... Read more →

GBP/USD up to 1.2857

February 15, 2019 11:15 am | By admin

Triangle has broken through the resistance line at 15-Feb-2019 05:15... Read more →

USD/JPY down to 109.7998

February 15, 2019 11:15 am | By admin

Channel Up has broken through the support line at 14-Feb-2019... Read more →

  • About Us
  • Privacy Policy
  • Disclaimer
  • Terms and Conditions
  • Get started for FREE
  • Contact Us
Copyright © 2018 Autochartist.com. All rights reserved.
Register

Sign-up


I accept the Privacy Policy, Disclaimer and Conditions of this service

* = Required Field

This site uses cookies: Find out more.