Help & Documentation
  • Home
  • Sign In
  • Contact Us
  • Home
  • Sign In
  • Contact Us

GBP/USD down to 1.3473

/Forex Technical Analysis - TD/GBP/USD down to 1.3473

GBP/USD down to 1.3473

Posted on January 11, 2021 by admin wrote in Forex Technical Analysis - TD.

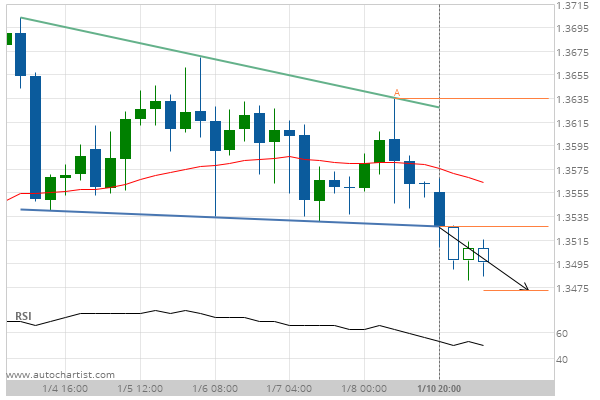
Descending Triangle has broken through the support line at 10-Jan-2021 20:00 EST. Possible bearish price movement forecast for the next 24 hours towards 1.3473.

Tags: GBPUSD
0 Likes
23 Views

You may also like

XAG/USD up to 14.6550
December 5, 2018
EUR/CHF up to 1.1249
May 31, 2019
USD/CAD down to 1.3225
January 9, 2019

Comments are closed.

GBP/CHF up to 1.2057 Goldman Sachs Group Inc. (GS) excessive bearish movement

Forex Technical Analysis – TD

EUR/NZD up to 1.6981

January 22, 2021 11:14 am | By admin

Triangle has broken through the resistance line at 21-Jan-2021 22:00... Read more →

GBP/NZD down to 1.8967

January 22, 2021 11:14 am | By admin

Approaching Support level of 1.8967 identified at 22-Jan-2021 03:00 EST Read more →

GBP/CHF down to 1.2064

January 22, 2021 11:14 am | By admin

Rising Wedge identified at 21-Jan-2021 16:00 EST. This pattern is... Read more →

EUR/CAD up to 1.5520

January 22, 2021 11:14 am | By admin

Channel Down has broken through the resistance line at 22-Jan-2021... Read more →

EUR/JPY up to 126.6181

January 22, 2021 11:14 am | By admin

Broke through Resistance level of 126.2120 at 22-Jan-2021 05:30 EST Read more →

  • About Us
  • Privacy Policy
  • Disclaimer
  • Terms and Conditions
  • Get started for FREE
  • Contact Us
Copyright © 2020 Autochartist.com. All rights reserved.
This site uses cookies: Find out more.