Help & Documentation
  • Home
  • Sign In
  • Contact Us
  • Home
  • Sign In
  • Contact Us

Exxon Mobil Corp. () down to 67.88

/US Stocks Technical Analysis - TD/Exxon Mobil Corp. () down to 67.88

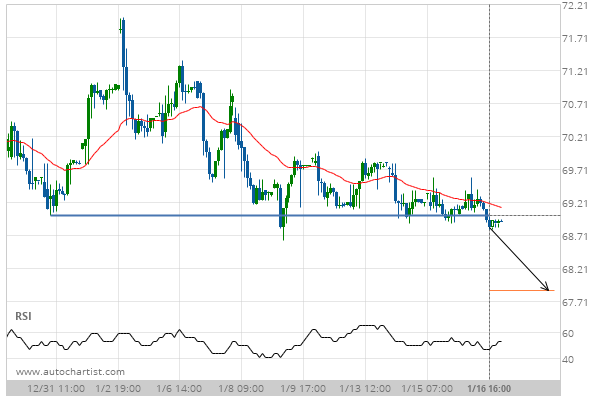
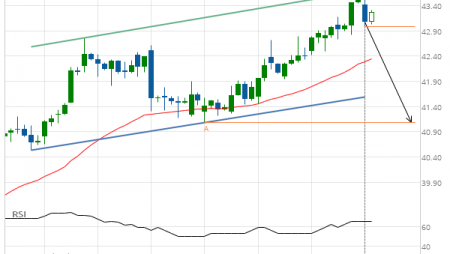
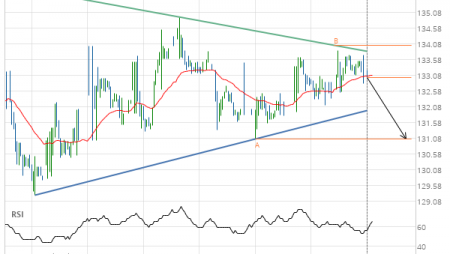
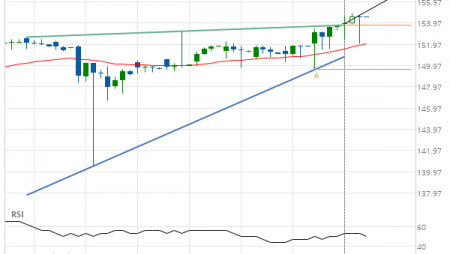
Exxon Mobil Corp. () down to 67.88

Posted on January 17, 2020 by Autochartist wrote in US Stocks Technical Analysis - TD.

Broke through Support level of 69.01 at 16-Jan-2020 16:00 EST

Tags: Exxon Mobil Corp., XOM
0 Likes
533 Views

You may also like

Jpmorgan Chase & Co. (JPM) down to 97.55
October 8, 2020
Microsoft Corporation (MSFT) down to 192.28
October 30, 2020
Goldman Sachs Group Inc. (GS) down to 145.94
March 17, 2020

Comments are closed.

USD/JPY excessive bearish movement General Electric Co. () down to 11.71

US Stocks Technical Analysis – TD

Merck & Co. Inc. (MRK) up to 75.56

March 9, 2021 11:13 am | By Autochartist

Rising Wedge identified at 08-Mar-2021 19:30 EST. This pattern is... Read more →

Jpmorgan Chase & Co. (JPM) down to 147.97

March 9, 2021 11:13 am | By Autochartist

Channel Up identified at 08-Mar-2021 19:00 EST. This pattern is... Read more →

Visa (V) down to 215.41

March 9, 2021 11:13 am | By Autochartist

Triangle identified at 08-Mar-2021 20:00 EST. This pattern is still... Read more →

Home Depot Inc. (HD) down to 247.10

March 9, 2021 11:13 am | By Autochartist

Channel Down identified at 08-Mar-2021 16:00 EST. This pattern is... Read more →

Intel Corporation () down to 58.10

March 9, 2021 11:13 am | By Autochartist

Approaching Support level of 58.10 identified at 08-Mar-2021 16:00 EST Read more →

  • About Us
  • Privacy Policy
  • Disclaimer
  • Terms and Conditions
  • Get started for FREE
  • Contact Us
Copyright © 2020 Autochartist.com. All rights reserved.
This site uses cookies: Find out more.