Help & Documentation
  • Home
  • Sign In
  • Contact Us
  • Home
  • Sign In
  • Contact Us

General Electric Co. () down to 11.71

/US Stocks Technical Analysis - TD/General Electric Co. () down to 11.71

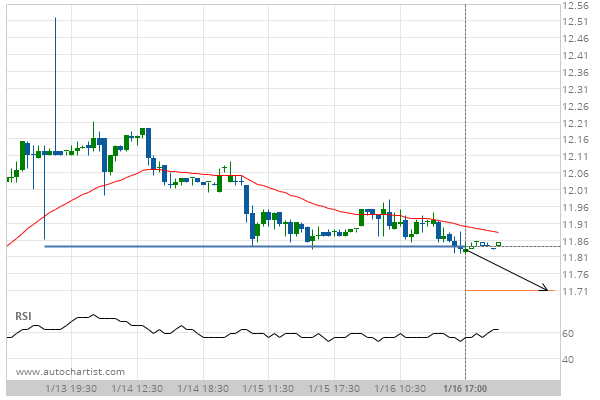
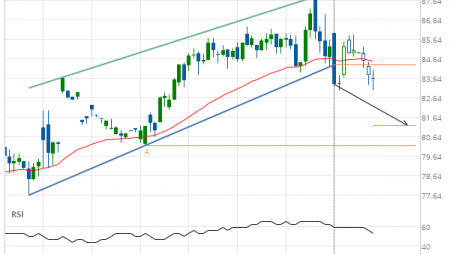
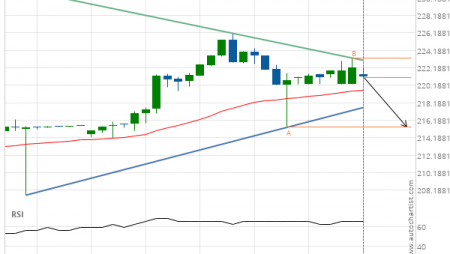
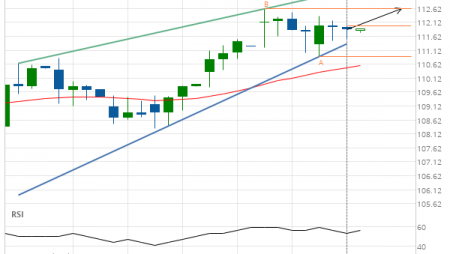
General Electric Co. () down to 11.71

Posted on January 17, 2020 by Autochartist wrote in US Stocks Technical Analysis - TD.

Broke through Support level of 11.84 at 16-Jan-2020 17:00 EST

Tags: GE, General Electric Co.
0 Likes
639 Views

You may also like

Travelers Cos Inc. (TRV) down to 140.17
October 16, 2019
Caterpillar Inc. (CAT) down to 120.26
May 30, 2019
Mcdonalds Corp. (MCD) down to 183.10
January 25, 2019

Comments are closed.

Exxon Mobil Corp. () down to 67.88 CHF/JPY excessive bullish movement

US Stocks Technical Analysis – TD

Merck & Co. Inc. (MRK) up to 75.56

March 9, 2021 11:13 am | By Autochartist

Rising Wedge identified at 08-Mar-2021 19:30 EST. This pattern is... Read more →

Jpmorgan Chase & Co. (JPM) down to 147.97

March 9, 2021 11:13 am | By Autochartist

Channel Up identified at 08-Mar-2021 19:00 EST. This pattern is... Read more →

Visa (V) down to 215.41

March 9, 2021 11:13 am | By Autochartist

Triangle identified at 08-Mar-2021 20:00 EST. This pattern is still... Read more →

Home Depot Inc. (HD) down to 247.10

March 9, 2021 11:13 am | By Autochartist

Channel Down identified at 08-Mar-2021 16:00 EST. This pattern is... Read more →

Intel Corporation () down to 58.10

March 9, 2021 11:13 am | By Autochartist

Approaching Support level of 58.10 identified at 08-Mar-2021 16:00 EST Read more →

  • About Us
  • Privacy Policy
  • Disclaimer
  • Terms and Conditions
  • Get started for FREE
  • Contact Us
Copyright © 2022 Autochartist.com. All rights reserved.
This site uses cookies: Find out more.