Help & Documentation
  • Home
  • Sign In
  • Contact Us
  • Home
  • Sign In
  • Contact Us

E-mini S&P 500 up to 3004.9738

/Futures Technical Analysis - TD/E-mini S&P 500 up to 3004.9738

E-mini S&P 500 up to 3004.9738

Posted on May 25, 2020 by Autochartist wrote in Futures Technical Analysis - TD.

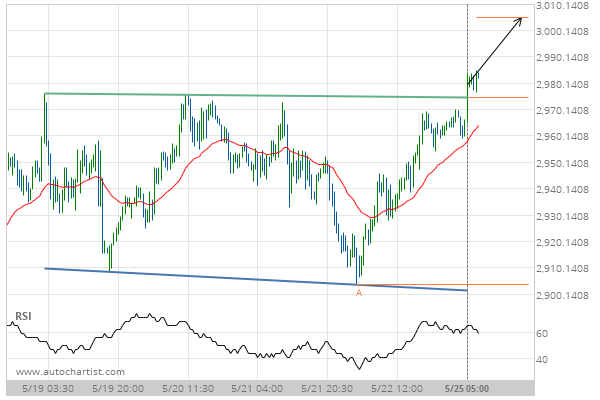
Rectangle has broken through the resistance line at 25-May-2020 05:00 EDT. Possible bullish price movement forecast for the next day towards 3004.9738.

Tags: CME, ES
0 Likes
565 Views

You may also like

Soybean Oil down to 29.8000
February 15, 2019
US T-Bond down to 176.4838
May 29, 2020
Silver Front Month down to 17.4645
January 15, 2020

Comments are closed.

Silver Front Month down to 17.1900 Home Depot Inc. (HD) excessive bearish movement

Futures Technical Analysis – TD

Light Sweet Crude Oil Front Month up to 67.9800

March 9, 2021 11:17 am | By Autochartist

Rising Wedge identified at 09-Mar-2021 05:00 EST. This pattern is... Read more →

Feeder Cattle Front Month down to 137.2250

March 9, 2021 11:17 am | By Autochartist

Channel Down identified at 08-Mar-2021 14:00 EST. This pattern is... Read more →

Soybean Oil up to 53.2300

March 9, 2021 11:17 am | By Autochartist

Channel Up identified at 09-Mar-2021 04:30 EST. This pattern is... Read more →

Silver Front Month up to 26.5600

March 9, 2021 11:17 am | By Autochartist

Approaching Resistance level of 26.5600 identified at 09-Mar-2021 04:00 EST Read more →

10 year T-Note up to 133.1644

March 9, 2021 11:17 am | By Autochartist

Falling Wedge has broken through the resistance line at 09-Mar-2021... Read more →

  • About Us
  • Privacy Policy
  • Disclaimer
  • Terms and Conditions
  • Get started for FREE
  • Contact Us
Copyright © 2022 Autochartist.com. All rights reserved.
This site uses cookies: Find out more.