Help & Documentation
  • Home
  • Sign In
  • Contact Us
  • Home
  • Sign In
  • Contact Us

US T-Bond up to 169.4625

/Futures Technical Analysis - TD/US T-Bond up to 169.4625

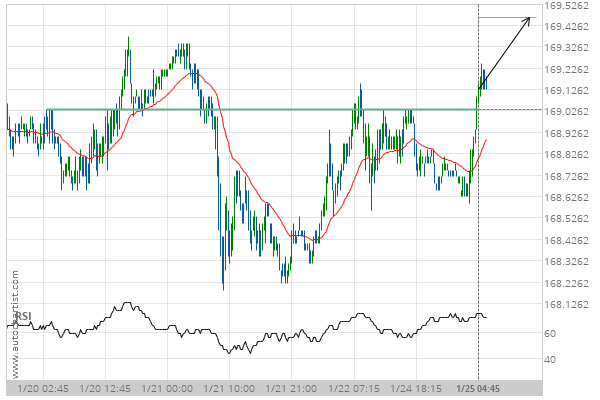
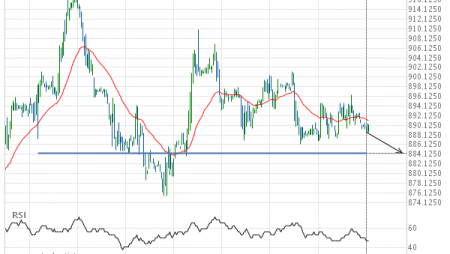
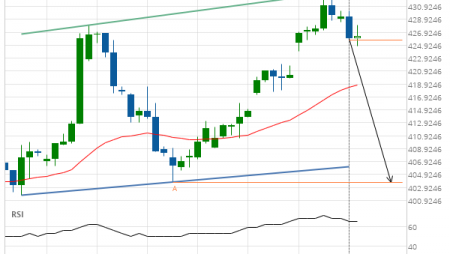
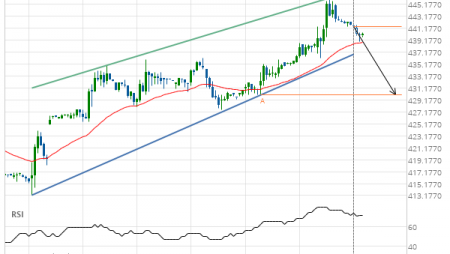
US T-Bond up to 169.4625

Posted on January 25, 2021 by Autochartist wrote in Futures Technical Analysis - TD.

Broke through Resistance level of 169.0313 at 25-Jan-2021 04:45 EST

Tags: ZB
0 Likes
333 Views

You may also like

10 year T-Note down to 137.7188
December 15, 2020
Corn down to 370.3207
January 16, 2019
Silver Front Month up to 17.2000
November 27, 2019

Comments are closed.

Gold Front Month up to 1874.6000 CAD/CHF excessive bearish movement

Futures Technical Analysis – TD

Light Sweet Crude Oil Front Month up to 67.9800

March 9, 2021 11:17 am | By Autochartist

Rising Wedge identified at 09-Mar-2021 05:00 EST. This pattern is... Read more →

Feeder Cattle Front Month down to 137.2250

March 9, 2021 11:17 am | By Autochartist

Channel Down identified at 08-Mar-2021 14:00 EST. This pattern is... Read more →

Soybean Oil up to 53.2300

March 9, 2021 11:17 am | By Autochartist

Channel Up identified at 09-Mar-2021 04:30 EST. This pattern is... Read more →

Silver Front Month up to 26.5600

March 9, 2021 11:17 am | By Autochartist

Approaching Resistance level of 26.5600 identified at 09-Mar-2021 04:00 EST Read more →

10 year T-Note up to 133.1644

March 9, 2021 11:17 am | By Autochartist

Falling Wedge has broken through the resistance line at 09-Mar-2021... Read more →

  • About Us
  • Privacy Policy
  • Disclaimer
  • Terms and Conditions
  • Get started for FREE
  • Contact Us
Copyright © 2022 Autochartist.com. All rights reserved.
This site uses cookies: Find out more.