Help & Documentation
  • Home
  • Sign In
  • Contact Us
  • Home
  • Sign In
  • Contact Us

E-mini S&P 500 down to 2995.5279

/Futures Technical Analysis - TD/E-mini S&P 500 down to 2995.5279

E-mini S&P 500 down to 2995.5279

Posted on July 30, 2019 by Autochartist wrote in Futures Technical Analysis - TD.

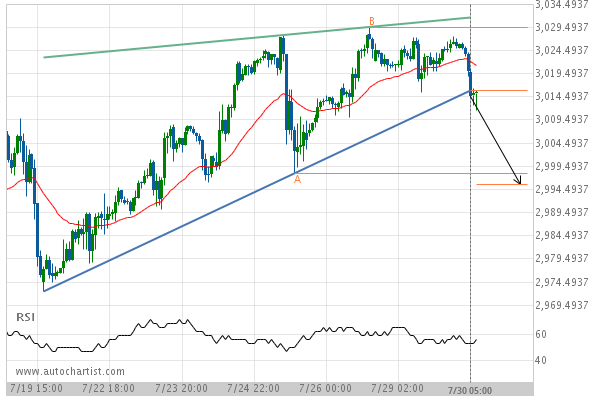
Rising Wedge has broken through the support line at 30-Jul-2019 05:00 EDT. Possible bearish price movement forecast for the next 2 days towards 2995.5279.

Tags: CME, ES
0 Likes
553 Views

You may also like

Soybean Meal up to 286.7900
May 20, 2020
Light Sweet Crude Oil Front Month up to 26.6000
April 17, 2020
Soybeans down to 862.5591
March 9, 2020

Comments are closed.

US T-Bond up to 154.9688 10 year T-Note down to 127.3281

Futures Technical Analysis – TD

Light Sweet Crude Oil Front Month up to 67.9800

March 9, 2021 11:17 am | By Autochartist

Rising Wedge identified at 09-Mar-2021 05:00 EST. This pattern is... Read more →

Feeder Cattle Front Month down to 137.2250

March 9, 2021 11:17 am | By Autochartist

Channel Down identified at 08-Mar-2021 14:00 EST. This pattern is... Read more →

Soybean Oil up to 53.2300

March 9, 2021 11:17 am | By Autochartist

Channel Up identified at 09-Mar-2021 04:30 EST. This pattern is... Read more →

Silver Front Month up to 26.5600

March 9, 2021 11:17 am | By Autochartist

Approaching Resistance level of 26.5600 identified at 09-Mar-2021 04:00 EST Read more →

10 year T-Note up to 133.1644

March 9, 2021 11:17 am | By Autochartist

Falling Wedge has broken through the resistance line at 09-Mar-2021... Read more →

  • About Us
  • Privacy Policy
  • Disclaimer
  • Terms and Conditions
  • Get started for FREE
  • Contact Us
Copyright © 2020 Autochartist.com. All rights reserved.
This site uses cookies: Find out more.