Help & Documentation
  • Home
  • Sign In
  • Contact Us
  • Home
  • Sign In
  • Contact Us

Soybean Oil up to 29.5376

/Futures Technical Analysis - TD/Soybean Oil up to 29.5376

Soybean Oil up to 29.5376

Posted on March 19, 2019 by admin wrote in Futures Technical Analysis - TD.

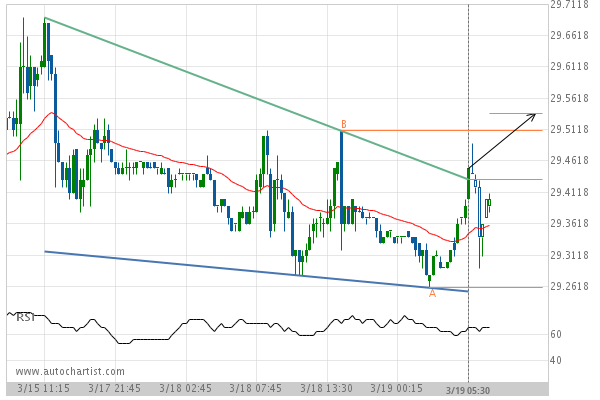
Falling Wedge has broken through the resistance line at 19-Mar-2019 05:30 EDT. Possible bullish price movement forecast for the next 8 hours towards 29.5376.

Tags: CBOT, ZL
0 Likes
451 Views

You may also like

US T-Bond down to 173.6875
October 6, 2020
Light Sweet Crude Oil Front Month down to 49.4200
February 13, 2020
Soybeans down to 909.5000
March 1, 2019

Comments are closed.

Coca-Cola Co. (KO) down to 44.42 Apple Inc. (AAPL) excessive bearish movement

Futures Technical Analysis – TD

Gold Front Month up to 1894.1381

January 15, 2021 11:18 am | By admin

Triangle has broken through the resistance line at 14-Jan-2021 12:00... Read more →

Feeder Cattle Front Month down to 132.6750

January 15, 2021 11:18 am | By admin

Flag identified at 14-Jan-2021 15:00 EST. This pattern is still... Read more →

Soybean Oil up to 44.1800

January 15, 2021 11:18 am | By admin

Approaching Resistance level of 44.1800 identified at 14-Jan-2021 13:00 EST Read more →

Soybeans up to 1436.5000

January 15, 2021 11:18 am | By admin

Rising Wedge identified at 15-Jan-2021 05:00 EST. This pattern is... Read more →

Light Sweet Crude Oil Front Month down to 52.1300

January 15, 2021 11:18 am | By admin

Approaching Support level of 52.1300 identified at 15-Jan-2021 04:00 EST Read more →

  • About Us
  • Privacy Policy
  • Disclaimer
  • Terms and Conditions
  • Get started for FREE
  • Contact Us
Copyright © 2020 Autochartist.com. All rights reserved.
This site uses cookies: Find out more.