Daily Forex Update: NZD/CAD
By: Dima Chernovolov
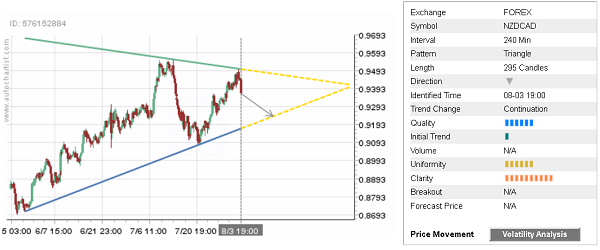
Autochartist recently identified the Clear Triangle chart pattern on the 4-hour NZD/CAD charts. Autochartist rates the Quality of this chart pattern at the 6-bar level – which is the result of the slow Initial Trend (1 bar), above-average Uniformity (6-bars) and maximum Clarity (10 bars). High Clarity reflects the sharpness of the price impulses between the connecting points of this Triangle. NZD/CAD is likely to fall to the lower support trendline of this chart pattern.

As can be seen from the following weekly NZD/CAD chart – this Triangle formed near the upper weekly Bollinger band and the major long-term resistance level 0.9530 (which has been steadily reversing the pair from the start of 2014). The proximity of this resistance level adds to the probability NZD/CAD will continue to fall inside this Triangle.

To subscribe to the e-mail alerts feature is quick and easy. Log into the Autochartist platform, click on ‘Alerts & Messaging’, enter your email address, select the market you want covered, select your language, and the time you want to get your report, and you’re done! You will now receive a quick morning technical outlook of the markets.
For further information on this and other Autochartist products visit www.autochartist.com