Daily Forex Update: NZD/USD
By: Dima Chernovolov
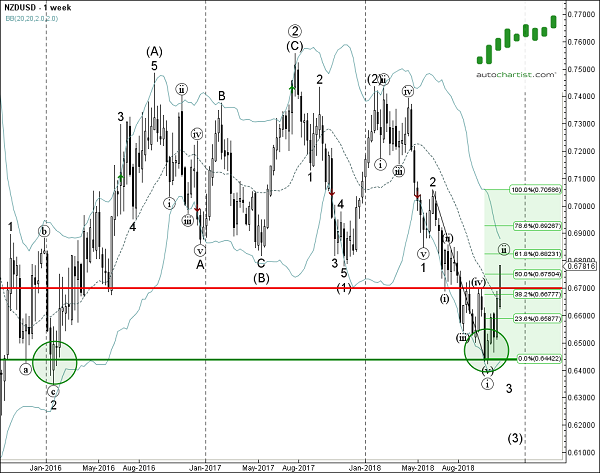
NZD/USD continues to rise inside the clear 30-minute Rising Wedge chart pattern which was recently identified by Autochartist. Autochartist rates the quality of this Rising Wedge at the 5-bar level – which reflects the slow Initial Trend (2 bars), strong Uniformity (8 bars) and average Clarity (5 bars). NZD/USD is expected to rise further inside this chart pattern – in line with the the eatrlier breakout of the key resistnace area shown below.
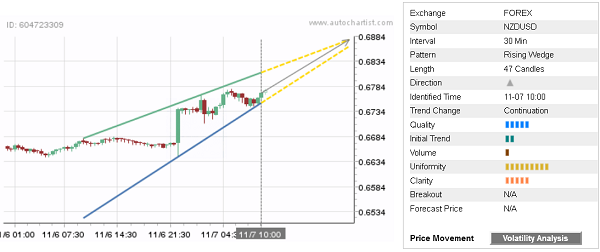
As can be seen from the weekly NZD/USD chart below, the price earlier broke through the resistnace area lyign between the key resistnace level 0.6700 and the 38.2% Fibonacci correction of the previous sharp downward impulse from the middle of 2018. This price area is acting as a strong support zone after it was broken. The proximity of this support zone increases the probability NZD/USD will continue to rise inside this Rising Wedge.
To subscribe to the e-mail alerts feature is quick and easy. Log into the Autochartist platform, click on ‘Alerts & Messaging’, enter your email address, select the market you want covered, select your language, and the time you want to get your report, and you’re done! You will now receive a quick morning technical outlook of the markets.
For further information on this and other Autochartist products visit www.autochartist.com