Help & Documentation
  • Home
  • Sign In
  • Contact Us
  • Home
  • Sign In
  • Contact Us

Chevron (CVX) up to 96.92

/US Stocks Technical Analysis - TD/Chevron (CVX) up to 96.92

Chevron (CVX) up to 96.92

Posted on December 11, 2020 by admin wrote in US Stocks Technical Analysis - TD.

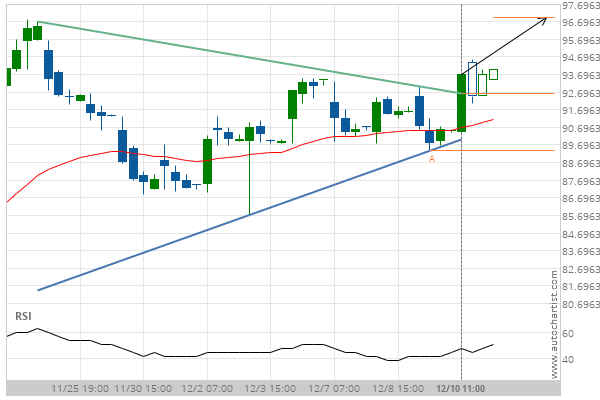
Triangle has broken through the resistance line at 10-Dec-2020 11:00 EST. Possible bullish price movement forecast for the next 2 days towards 96.92.

Tags: Chevron, CVX, NYSE
0 Likes
27 Views

You may also like

3m Co. (MMM) down to 159.70
June 11, 2020
3m Co. (MMM) up to 220.16
April 25, 2019
Goldman Sachs Group Inc. (GS) up to 224.67
November 11, 2019

Comments are closed.

General Electric Co. (GE) up to 11.50 USD/CAD up to 1.2826

US Stocks Technical Analysis – TD

Jpmorgan Chase & Co. () down to 134.11

January 22, 2021 11:16 am | By admin

Approaching Support level of 134.11 identified at 21-Jan-2021 20:00 EST Read more →

Intel Corporation () down to 56.92

January 22, 2021 11:16 am | By admin

Approaching Support level of 56.92 identified at 21-Jan-2021 18:30 EST Read more →

Microsoft Corporation (MSFT) up to 226.30

January 22, 2021 11:16 am | By admin

Ascending Triangle identified at 21-Jan-2021 18:45 EST. This pattern is... Read more →

Apple Inc. (AAPL) down to 127.02

January 22, 2021 11:16 am | By admin

Channel Up identified at 21-Jan-2021 20:00 EST. This pattern is... Read more →

Home Depot Inc. (HD) down to 271.50

January 22, 2021 11:16 am | By admin

Rising Wedge identified at 21-Jan-2021 16:30 EST. This pattern is... Read more →

  • About Us
  • Privacy Policy
  • Disclaimer
  • Terms and Conditions
  • Get started for FREE
  • Contact Us
Copyright © 2020 Autochartist.com. All rights reserved.
This site uses cookies: Find out more.