Daily Forex Update: AUD/CAD
By: Dima Chernovolov
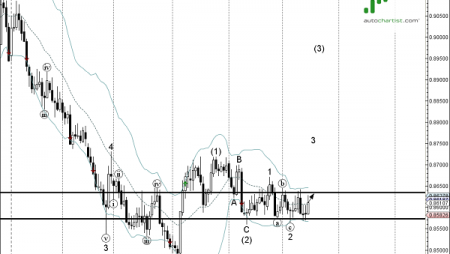
AUD/CAD continues to fall after the recent breakout of the clear 30-minute Triangle chart pattern which was previously identified by Autochartist. Autochartist rates the quality of this Triangle at the 6-bar level – which is the result of the slow Initial Trend (2 bars), average Uniformity (5 bars) and high Clarity (8 bars). AUD/CAD is expected to fall toward the forecast price 0.9648 – in line with the earlier downward reversal from the of strong resistance level shown below.

As can be seen from the daily AUD/CAD chart below, the top of this Triangle formed when the price reversed down from the strong resistance level 0.97000 (former powerful support level which reversed the price in October and September). The proximity of this resistance level increases the probability AUD/CAD will soon reach the forecast price 0.9648.

To subscribe to the e-mail alerts feature is quick and easy. Log into the Autochartist platform, click on ‘Alerts & Messaging’, enter your email address, select the market you want covered, select your language, and the time you want to get your report, and you’re done! You will now receive a quick morning technical outlook of the markets.
For further information on this and other Autochartist products visit www.autochartist.com