Trade of the Day: AUD/NZD
By: Dima Chernovolov
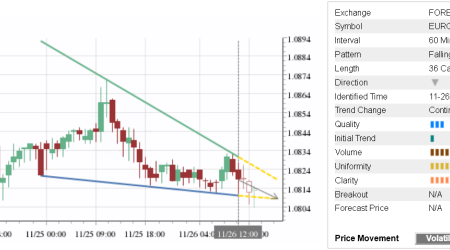
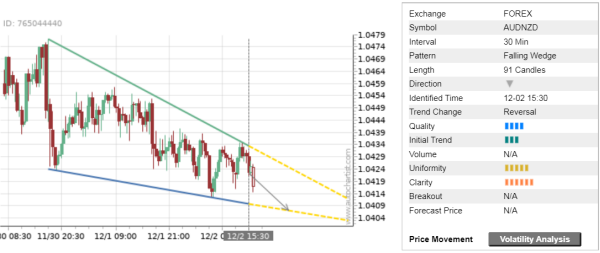
AUD/NZD continues to fall inside the 30-minute Falling Wedge chart pattern, which was previously identified by Autochartist. Autochartist rates the quality of this Falling Wedge at the 4-bar level – which is the result of the slow Initial Trend (3 bars), medium Uniformity (5 bars) and higher Clarity (6 bars). AUD/NZD is expected to fall further inside this Falling Wedge.
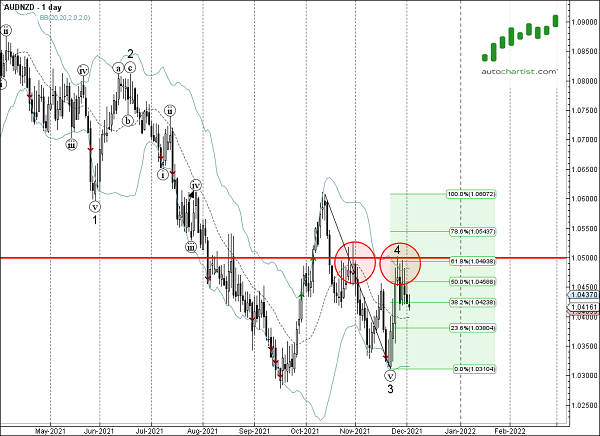
As can be seen from the daily AUD/NZD chart below – the price earlier reversed down from the resistance area located between the strong round resistance level 1.05 (which has been repeatedly reversing the pair from October), upper daily Bollinger Band and the 61.8% Fibonacci correction of the downward impulse from October. The proximity of this resistance area adds to the probability AUD/NZD will continue to fall inside this Falling Wedge.