Trade of the Day: USD/CAD
By: Dima Chernovolov
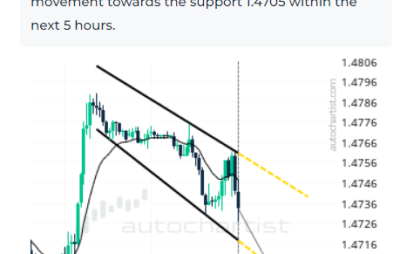
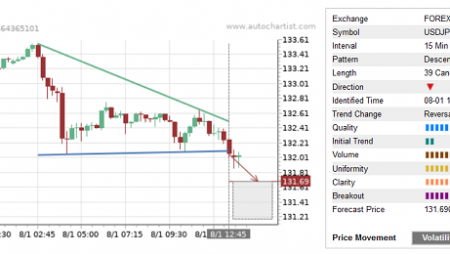
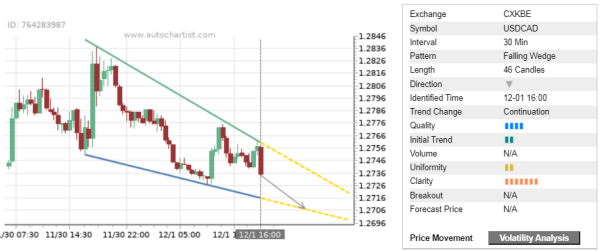
USD/CAD continues to fall inside the well-formed 30-minute Falling Wedge chart pattern, which was recently identified by Autochartist. Autochartist rates the quality of this Falling Wedge at the 4-bar level – which is the result of the slow Initial Trend and Uniformity (2 bars) and significant Clarity (7 bars). USD/CAD is expected to fall further inside this Falling Wedge.
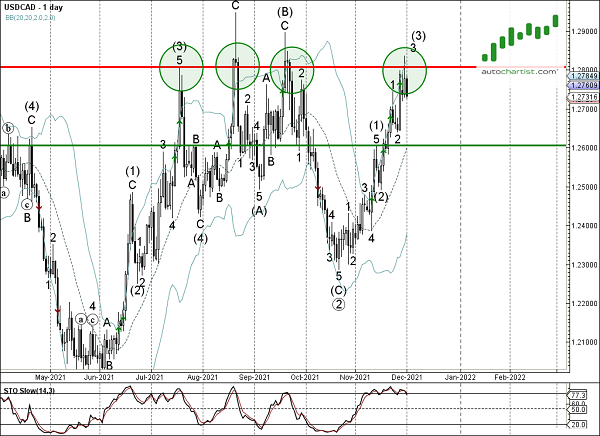
As can be seen from the daily USD/CAD chart below – the price earlier reversed down from the resistance area located between the long-term resistance level 1.28 (which has been reversing the price from July) and the upper daily Bollinger Band. The proximity of this resistance area increases the probability USD/CAD will continue to fall inside this Falling Wedge.