Trade of the Day: NZD/JPY
By: Dima Chernovolov
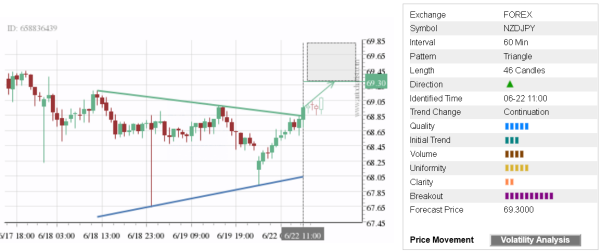
NZD/JPY continues to rise sharply after the earlier breakout of the hourly Triangle chart pattern which was recently identified by Autochartist. Autochartist rates the quality of this Triangle at the 5-bar level – which reflects the slow Initial Trend (3 bars), medium Uniformity (5 bars) and lower Clarity (2 bars). Autochartist rates the strength of this breakout at the maximum 10-bar level. NZD/JPY is expected to rise toward the forecast price 69.30 – in line with the earlier upward reversal form the support area shown below.
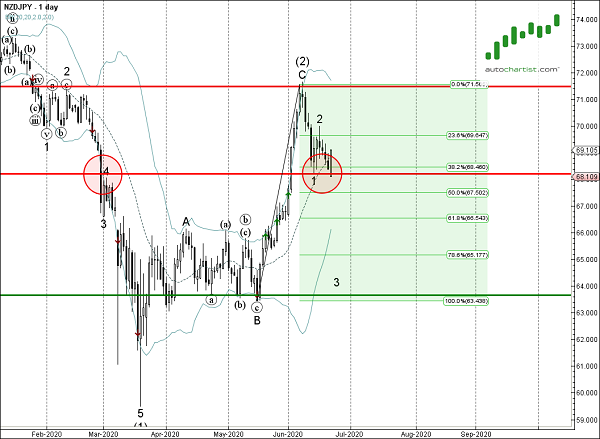
As can be seen from the daily NZD/JPY chart below – the bottom of this Triangle formed near the support area lying between the key support level 68.20, lower daily Bollinger band and the 38.2% Fibonacci retracement of the earlier upward impulse from May. The proximity of this support area increases the probability NZD/JPY will continue to rise toward the forecast price 69.30.