Help & Documentation
  • Home
  • Sign In
  • Contact Us
  • Home
  • Sign In
  • Contact Us

E-mini S&P 500 excessive bearish movement

/Futures Statistical Analysis - TD/E-mini S&P 500 excessive bearish movement

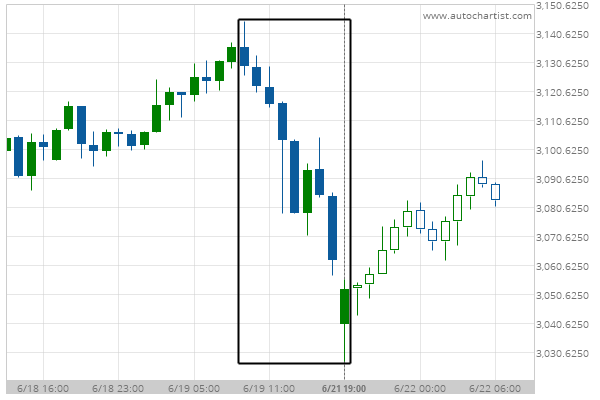
E-mini S&P 500 excessive bearish movement

Posted on June 22, 2020 by Autochartist wrote in Futures Statistical Analysis - TD.

E-mini S&P 500 experienced a 2.45% bearish movement in the last 58 hours.

Tags: Big Movement, ES
0 Likes
599 Views

You may also like

Soybeans excessive bearish movement
April 23, 2020
Gold Front Month excessive bearish movement
June 24, 2019
Soybean Oil excessive bearish movement
November 18, 2020

Comments are closed.

Chevron () down to 89.46 Trade of the Day: NZD/JPY

Futures Statistical Analysis – TD

Soybean Oil excessive bearish movement

March 9, 2021 11:16 am | By Autochartist

Soybean Oil experienced a 19.04% bullish movement in the last... Read more →

Corn excessive bearish movement

March 8, 2021 11:19 am | By Autochartist

Corn experienced a 4.61% bullish movement in the last 73... Read more →

Gold Front Month excessive bearish movement

March 8, 2021 11:19 am | By Autochartist

Gold Front Month experienced a 6.29% bearish movement in the... Read more →

Light Sweet Crude Oil Front Month excessive bearish movement

March 8, 2021 11:19 am | By Autochartist

Light Sweet Crude Oil Front Month experienced a 8.6% bullish... Read more →

10 year T-Note excessive bearish movement

March 8, 2021 11:19 am | By Autochartist

10 year T-Note experienced a 3.4% bearish movement in the... Read more →

  • About Us
  • Privacy Policy
  • Disclaimer
  • Terms and Conditions
  • Get started for FREE
  • Contact Us
Copyright © 2022 Autochartist.com. All rights reserved.
This site uses cookies: Find out more.