Help & Documentation
  • Home
  • Sign In
  • Contact Us
  • Home
  • Sign In
  • Contact Us

10 year T-Note down to 138.5781

/Futures Technical Analysis - TD/10 year T-Note down to 138.5781

10 year T-Note down to 138.5781

Posted on May 27, 2020 by Autochartist wrote in Futures Technical Analysis - TD.

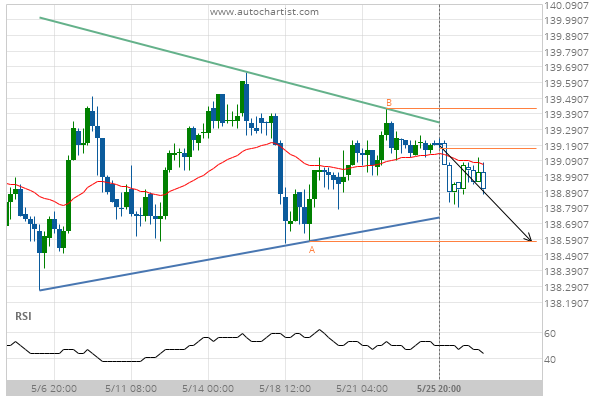
Triangle identified at 25-May-2020 20:00 EDT. This pattern is still in the process of forming. Possible bearish price movement towards the support 138.5781 within the next 3 days.

Tags: CBOT, ZN
0 Likes
396 Views

You may also like

E-mini S&P 500 up to 2873.5000
April 2, 2019
Corn down to 378.0000
March 5, 2020
Gold Front Month down to 1683.0000
May 11, 2020

Comments are closed.

Johnson & Johnson (JNJ) excessive bearish movement US T-Bond down to 178.0281

Futures Technical Analysis – TD

Light Sweet Crude Oil Front Month up to 67.9800

March 9, 2021 11:17 am | By Autochartist

Rising Wedge identified at 09-Mar-2021 05:00 EST. This pattern is... Read more →

Feeder Cattle Front Month down to 137.2250

March 9, 2021 11:17 am | By Autochartist

Channel Down identified at 08-Mar-2021 14:00 EST. This pattern is... Read more →

Soybean Oil up to 53.2300

March 9, 2021 11:17 am | By Autochartist

Channel Up identified at 09-Mar-2021 04:30 EST. This pattern is... Read more →

Silver Front Month up to 26.5600

March 9, 2021 11:17 am | By Autochartist

Approaching Resistance level of 26.5600 identified at 09-Mar-2021 04:00 EST Read more →

10 year T-Note up to 133.1644

March 9, 2021 11:17 am | By Autochartist

Falling Wedge has broken through the resistance line at 09-Mar-2021... Read more →

  • About Us
  • Privacy Policy
  • Disclaimer
  • Terms and Conditions
  • Get started for FREE
  • Contact Us
Copyright © 2020 Autochartist.com. All rights reserved.
This site uses cookies: Find out more.