Help & Documentation
  • Home
  • Sign In
  • Contact Us
  • Home
  • Sign In
  • Contact Us

US T-Bond up to 175.1844

/Futures Technical Analysis - TD/US T-Bond up to 175.1844

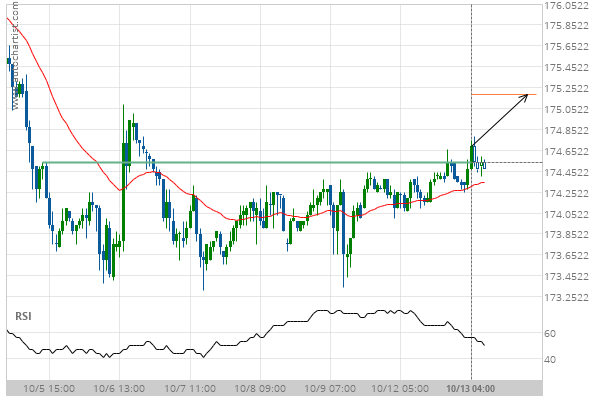
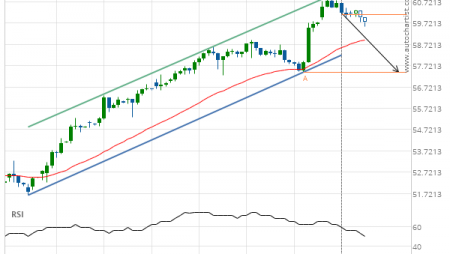
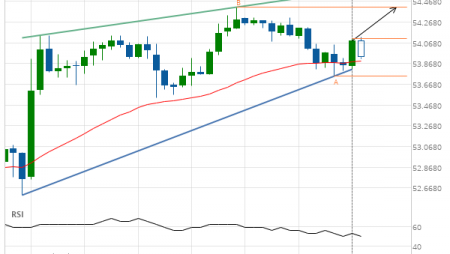
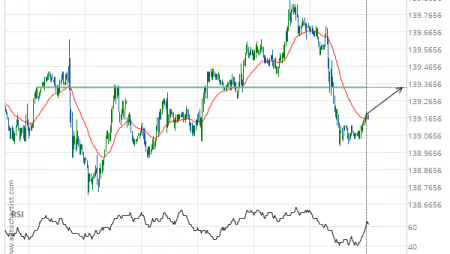
US T-Bond up to 175.1844

Posted on October 13, 2020 by Autochartist wrote in Futures Technical Analysis - TD.

Broke through Resistance level of 174.5313 at 13-Oct-2020 04:00 EDT

Tags: ZB
0 Likes
406 Views

You may also like

Soybeans up to 911.0000
August 24, 2020
Soybean Meal down to 291.3000
September 27, 2019
Gold Front Month up to 1732.2000
June 3, 2020

Comments are closed.

Soybean Oil up to 34.1350 Trade of the Day: EUR/GBP

Futures Technical Analysis – TD

Light Sweet Crude Oil Front Month up to 67.9800

March 9, 2021 11:17 am | By Autochartist

Rising Wedge identified at 09-Mar-2021 05:00 EST. This pattern is... Read more →

Feeder Cattle Front Month down to 137.2250

March 9, 2021 11:17 am | By Autochartist

Channel Down identified at 08-Mar-2021 14:00 EST. This pattern is... Read more →

Soybean Oil up to 53.2300

March 9, 2021 11:17 am | By Autochartist

Channel Up identified at 09-Mar-2021 04:30 EST. This pattern is... Read more →

Silver Front Month up to 26.5600

March 9, 2021 11:17 am | By Autochartist

Approaching Resistance level of 26.5600 identified at 09-Mar-2021 04:00 EST Read more →

10 year T-Note up to 133.1644

March 9, 2021 11:17 am | By Autochartist

Falling Wedge has broken through the resistance line at 09-Mar-2021... Read more →

  • About Us
  • Privacy Policy
  • Disclaimer
  • Terms and Conditions
  • Get started for FREE
  • Contact Us
Copyright © 2022 Autochartist.com. All rights reserved.
This site uses cookies: Find out more.