Help & Documentation
  • Home
  • Sign In
  • Contact Us
  • Home
  • Sign In
  • Contact Us

XAU/USD up to 1206.7100

/Forex Technical Analysis - TD/XAU/USD up to 1206.7100

XAU/USD up to 1206.7100

Posted on October 5, 2018 by Autochartist wrote in Forex Technical Analysis - TD.

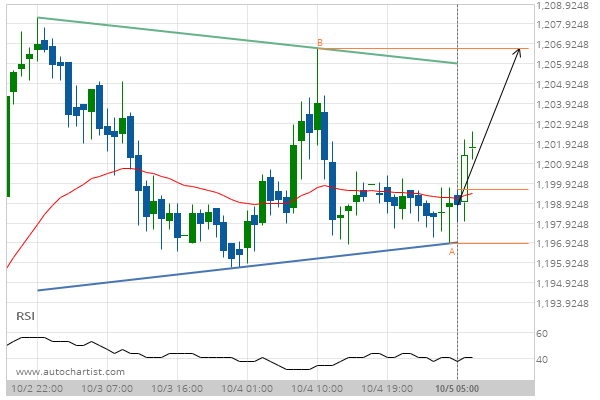
Triangle identified at 05-Oct-2018 05:00 EDT. This pattern is still in the process of forming. Possible bullish price movement towards the resistance 1206.7100 within the next 15 hours.

Tags: XAUUSD
0 Likes
1050 Views

You may also like

EUR/JPY down to 127.6000
February 26, 2021
GBP/CAD up to 1.7439
April 17, 2019
USD/CAD up to 1.3360
November 30, 2018

Comments are closed.

EUR/JPY down to 130.7100 GBP/USD up to 1.3217

Forex Technical Analysis – TD

EUR/CHF up to 1.1152

March 9, 2021 11:15 am | By Autochartist

Rising Wedge identified at 09-Mar-2021 00:00 EST. This pattern is... Read more →

EUR/JPY up to 129.6360

March 9, 2021 11:15 am | By Autochartist

Triangle identified at 08-Mar-2021 20:00 EST. This pattern is still... Read more →

NZD/USD up to 0.7188

March 9, 2021 11:15 am | By Autochartist

Broke through Resistance level of 0.7153 at 09-Mar-2021 04:00 EST Read more →

USD/JPY down to 108.1606

March 9, 2021 11:15 am | By Autochartist

Rising Wedge has broken through the support line at 09-Mar-2021... Read more →

USD/CHF down to 0.9284

March 9, 2021 11:15 am | By Autochartist

Approaching Support level of 0.9284 identified at 09-Mar-2021 05:15 EST Read more →

  • About Us
  • Privacy Policy
  • Disclaimer
  • Terms and Conditions
  • Get started for FREE
  • Contact Us
Copyright © 2022 Autochartist.com. All rights reserved.
This site uses cookies: Find out more.