Help & Documentation
  • Home
  • Sign In
  • Contact Us
  • Home
  • Sign In
  • Contact Us

XAU/USD down to 1284.3276

/Forex Technical Analysis - TD/XAU/USD down to 1284.3276

XAU/USD down to 1284.3276

Posted on April 1, 2019 by Autochartist wrote in Forex Technical Analysis - TD.

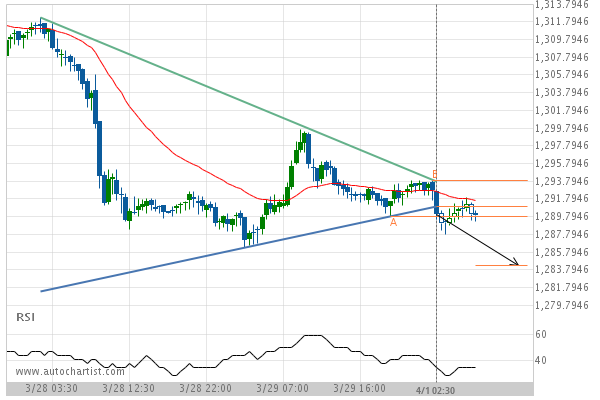
Triangle has broken through the support line at 01-Apr-2019 02:30 EDT. Possible bearish price movement forecast for the next 10 hours towards 1284.3276.

Tags: XAUUSD
0 Likes
774 Views

You may also like

EUR/CHF up to 1.0714
November 4, 2020
EUR/NZD up to 1.6796
July 29, 2019
NZD/USD up to 0.6959
November 18, 2020

Comments are closed.

Light Sweet Crude Oil MAY 2019 Target Level: 59.7500 EUR/CAD up to 1.5096

Forex Technical Analysis – TD

EUR/CHF up to 1.1152

March 9, 2021 11:15 am | By Autochartist

Rising Wedge identified at 09-Mar-2021 00:00 EST. This pattern is... Read more →

EUR/JPY up to 129.6360

March 9, 2021 11:15 am | By Autochartist

Triangle identified at 08-Mar-2021 20:00 EST. This pattern is still... Read more →

NZD/USD up to 0.7188

March 9, 2021 11:15 am | By Autochartist

Broke through Resistance level of 0.7153 at 09-Mar-2021 04:00 EST Read more →

USD/JPY down to 108.1606

March 9, 2021 11:15 am | By Autochartist

Rising Wedge has broken through the support line at 09-Mar-2021... Read more →

USD/CHF down to 0.9284

March 9, 2021 11:15 am | By Autochartist

Approaching Support level of 0.9284 identified at 09-Mar-2021 05:15 EST Read more →

  • About Us
  • Privacy Policy
  • Disclaimer
  • Terms and Conditions
  • Get started for FREE
  • Contact Us
Copyright © 2022 Autochartist.com. All rights reserved.
This site uses cookies: Find out more.