Help & Documentation
  • Home
  • Sign In
  • Contact Us
  • Home
  • Sign In
  • Contact Us

XAG/USD up to 19.5020

/Forex Technical Analysis - TD/XAG/USD up to 19.5020

XAG/USD up to 19.5020

Posted on September 5, 2019 by Autochartist wrote in Forex Technical Analysis - TD.

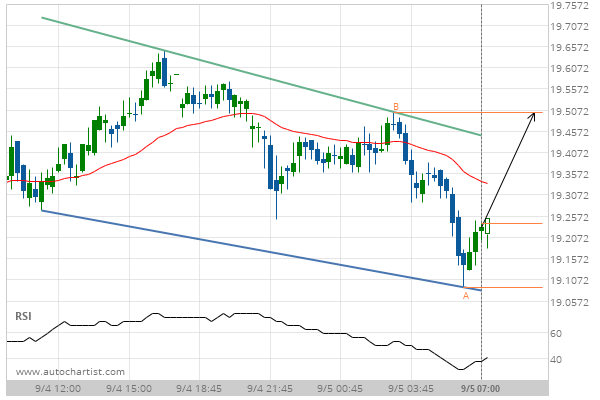
Channel Down identified at 05-Sep-2019 07:00 EDT. This pattern is still in the process of forming. Possible bullish price movement towards the resistance 19.5020 within the next 6 hours.

Tags: XAGUSD
0 Likes
575 Views

You may also like

NZD/USD down to 0.6607
January 9, 2020
USD/JPY up to 106.0540
August 10, 2020
USD/CAD down to 1.3180
August 17, 2020

Comments are closed.

EUR/CHF up to 1.0887 Unitedhealth Group Inc. (UNH) down to 220.78

Forex Technical Analysis – TD

EUR/CHF up to 1.1152

March 9, 2021 11:15 am | By Autochartist

Rising Wedge identified at 09-Mar-2021 00:00 EST. This pattern is... Read more →

EUR/JPY up to 129.6360

March 9, 2021 11:15 am | By Autochartist

Triangle identified at 08-Mar-2021 20:00 EST. This pattern is still... Read more →

NZD/USD up to 0.7188

March 9, 2021 11:15 am | By Autochartist

Broke through Resistance level of 0.7153 at 09-Mar-2021 04:00 EST Read more →

USD/JPY down to 108.1606

March 9, 2021 11:15 am | By Autochartist

Rising Wedge has broken through the support line at 09-Mar-2021... Read more →

USD/CHF down to 0.9284

March 9, 2021 11:15 am | By Autochartist

Approaching Support level of 0.9284 identified at 09-Mar-2021 05:15 EST Read more →

  • About Us
  • Privacy Policy
  • Disclaimer
  • Terms and Conditions
  • Get started for FREE
  • Contact Us
Copyright © 2020 Autochartist.com. All rights reserved.
This site uses cookies: Find out more.