Help & Documentation
  • Home
  • Sign In
  • Contact Us
  • Home
  • Sign In
  • Contact Us

XAG/USD down to 14.8700

/Forex Technical Analysis - TD/XAG/USD down to 14.8700

XAG/USD down to 14.8700

Posted on July 9, 2019 by Autochartist wrote in Forex Technical Analysis - TD.

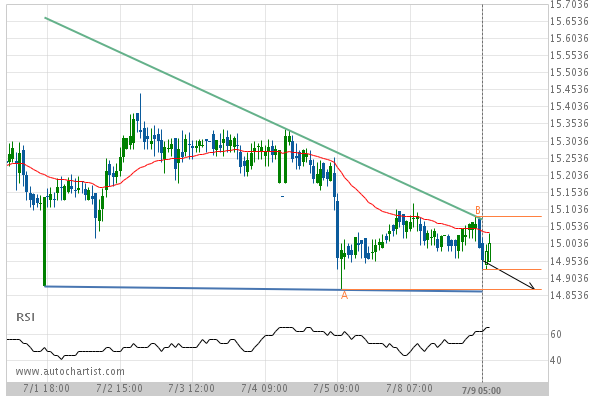
Descending Triangle identified at 09-Jul-2019 05:00 EDT. This pattern is still in the process of forming. Possible bearish price movement towards the support 14.8700 within the next 2 days.

Tags: XAGUSD
0 Likes
777 Views

You may also like

USD/JPY up to 113.5150
December 12, 2018
CAD/JPY up to 81.5790
June 12, 2019
GBP/USD up to 1.2530
July 6, 2020

Comments are closed.

EUR/USD up to 1.1218 CORN SEPTEMBER 2019 down to 413.5000

Forex Technical Analysis – TD

EUR/CHF up to 1.1152

March 9, 2021 11:15 am | By Autochartist

Rising Wedge identified at 09-Mar-2021 00:00 EST. This pattern is... Read more →

EUR/JPY up to 129.6360

March 9, 2021 11:15 am | By Autochartist

Triangle identified at 08-Mar-2021 20:00 EST. This pattern is still... Read more →

NZD/USD up to 0.7188

March 9, 2021 11:15 am | By Autochartist

Broke through Resistance level of 0.7153 at 09-Mar-2021 04:00 EST Read more →

USD/JPY down to 108.1606

March 9, 2021 11:15 am | By Autochartist

Rising Wedge has broken through the support line at 09-Mar-2021... Read more →

USD/CHF down to 0.9284

March 9, 2021 11:15 am | By Autochartist

Approaching Support level of 0.9284 identified at 09-Mar-2021 05:15 EST Read more →

  • About Us
  • Privacy Policy
  • Disclaimer
  • Terms and Conditions
  • Get started for FREE
  • Contact Us
Copyright © 2022 Autochartist.com. All rights reserved.
This site uses cookies: Find out more.