Help & Documentation
  • Home
  • Sign In
  • Contact Us
  • Home
  • Sign In
  • Contact Us

Walt Disney (DIS) up to 200.59

/US Stocks Technical Analysis - TD/Walt Disney (DIS) up to 200.59

Walt Disney (DIS) up to 200.59

Posted on March 8, 2021 by Autochartist wrote in US Stocks Technical Analysis - TD.

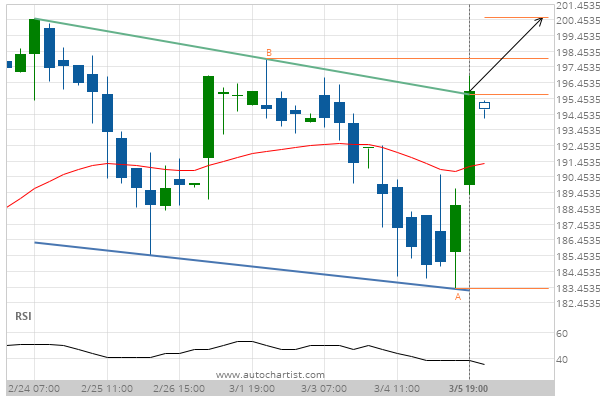
Flag has broken through the resistance line at 05-Mar-2021 19:00 EST. Possible bullish price movement forecast for the next 2 days towards 200.59.

Tags: DIS, NYSE, Walt Disney
0 Likes
241 Views

You may also like

Chevron (CVX) down to 123.03
June 27, 2019
Merck & Co. Inc. (MRK) up to 83.15
July 20, 2020
Wal-Mart Stores (WMT) up to 120.92
November 13, 2019

Comments are closed.

Coca-Cola Co. () up to 51.03 Verizon Communications Inc. () up to 57.16

US Stocks Technical Analysis – TD

Merck & Co. Inc. (MRK) up to 75.56

March 9, 2021 11:13 am | By Autochartist

Rising Wedge identified at 08-Mar-2021 19:30 EST. This pattern is... Read more →

Jpmorgan Chase & Co. (JPM) down to 147.97

March 9, 2021 11:13 am | By Autochartist

Channel Up identified at 08-Mar-2021 19:00 EST. This pattern is... Read more →

Visa (V) down to 215.41

March 9, 2021 11:13 am | By Autochartist

Triangle identified at 08-Mar-2021 20:00 EST. This pattern is still... Read more →

Home Depot Inc. (HD) down to 247.10

March 9, 2021 11:13 am | By Autochartist

Channel Down identified at 08-Mar-2021 16:00 EST. This pattern is... Read more →

Intel Corporation () down to 58.10

March 9, 2021 11:13 am | By Autochartist

Approaching Support level of 58.10 identified at 08-Mar-2021 16:00 EST Read more →

  • About Us
  • Privacy Policy
  • Disclaimer
  • Terms and Conditions
  • Get started for FREE
  • Contact Us
Copyright © 2020 Autochartist.com. All rights reserved.
This site uses cookies: Find out more.