Help & Documentation
  • Home
  • Sign In
  • Contact Us
  • Home
  • Sign In
  • Contact Us

Visa (V) up to 139.40

/US Stocks Technical Analysis - TD/Visa (V) up to 139.40

Visa (V) up to 139.40

Posted on January 22, 2019 by Autochartist wrote in US Stocks Technical Analysis - TD.

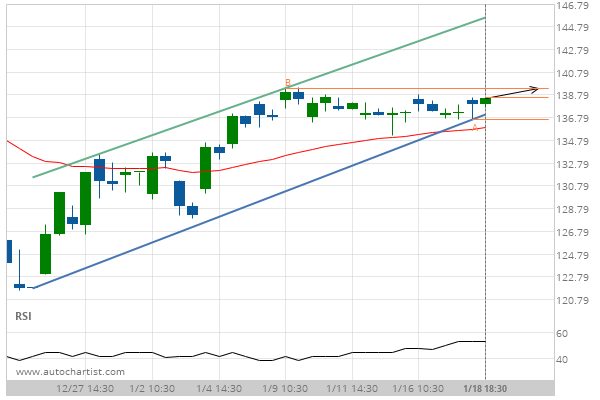
Channel Up identified at 18-Jan-2019 18:30 EST. This pattern is still in the process of forming. Possible bullish price movement towards the resistance 139.40 within the next 2 days.

Tags: NYSE, V, Visa
0 Likes
788 Views

You may also like

3m Co. (MMM) up to 160.98
June 3, 2020
Merck & Co. Inc. (MRK) up to 84.27
June 18, 2019
3m Co. (MMM) up to 170.66
May 28, 2019

Comments are closed.

Nike Inc. Cl B (NKE) down to 76.01 Wal-Mart Stores (WMT) down to 96.17

US Stocks Technical Analysis – TD

Merck & Co. Inc. (MRK) up to 75.56

March 9, 2021 11:13 am | By Autochartist

Rising Wedge identified at 08-Mar-2021 19:30 EST. This pattern is... Read more →

Jpmorgan Chase & Co. (JPM) down to 147.97

March 9, 2021 11:13 am | By Autochartist

Channel Up identified at 08-Mar-2021 19:00 EST. This pattern is... Read more →

Visa (V) down to 215.41

March 9, 2021 11:13 am | By Autochartist

Triangle identified at 08-Mar-2021 20:00 EST. This pattern is still... Read more →

Home Depot Inc. (HD) down to 247.10

March 9, 2021 11:13 am | By Autochartist

Channel Down identified at 08-Mar-2021 16:00 EST. This pattern is... Read more →

Intel Corporation () down to 58.10

March 9, 2021 11:13 am | By Autochartist

Approaching Support level of 58.10 identified at 08-Mar-2021 16:00 EST Read more →

  • About Us
  • Privacy Policy
  • Disclaimer
  • Terms and Conditions
  • Get started for FREE
  • Contact Us
Copyright © 2020 Autochartist.com. All rights reserved.
This site uses cookies: Find out more.