Help & Documentation
  • Home
  • Sign In
  • Contact Us
  • Home
  • Sign In
  • Contact Us

Visa () down to 190.46

/US Stocks Technical Analysis - TD/Visa () down to 190.46

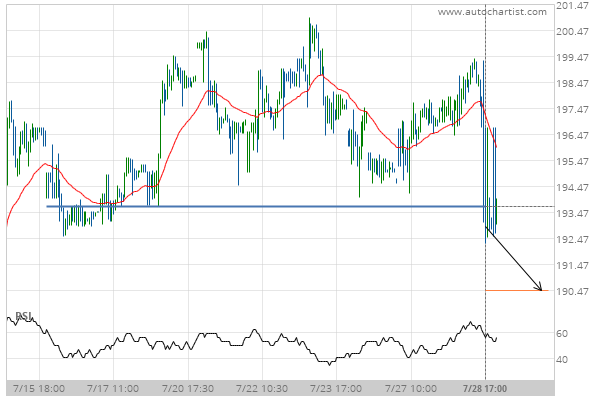
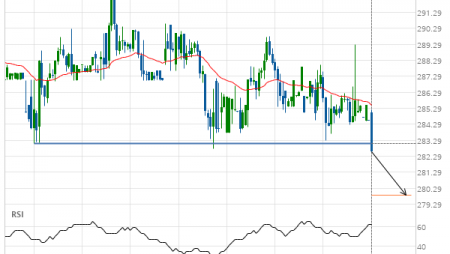
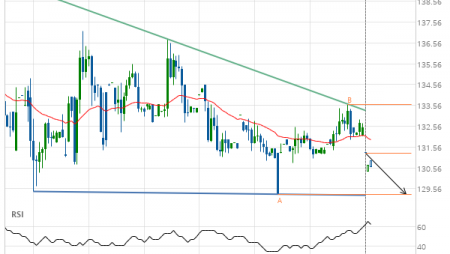
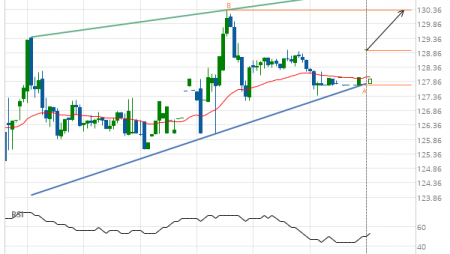
Visa () down to 190.46

Posted on July 29, 2020 by Autochartist wrote in US Stocks Technical Analysis - TD.

Broke through Support level of 193.67 at 28-Jul-2020 17:00 EDT

Tags: V, Visa
0 Likes
538 Views

You may also like

Chevron (CVX) down to 117.12
May 29, 2019
Nike Inc. Cl B (NKE) down to 93.00
July 21, 2020
General Electric Co. () up to 11.18
December 24, 2019

Comments are closed.

Jpmorgan Chase & Co. (JPM) down to 96.17 Corn down to 320.0000

US Stocks Technical Analysis – TD

Merck & Co. Inc. (MRK) up to 75.56

March 9, 2021 11:13 am | By Autochartist

Rising Wedge identified at 08-Mar-2021 19:30 EST. This pattern is... Read more →

Jpmorgan Chase & Co. (JPM) down to 147.97

March 9, 2021 11:13 am | By Autochartist

Channel Up identified at 08-Mar-2021 19:00 EST. This pattern is... Read more →

Visa (V) down to 215.41

March 9, 2021 11:13 am | By Autochartist

Triangle identified at 08-Mar-2021 20:00 EST. This pattern is still... Read more →

Home Depot Inc. (HD) down to 247.10

March 9, 2021 11:13 am | By Autochartist

Channel Down identified at 08-Mar-2021 16:00 EST. This pattern is... Read more →

Intel Corporation () down to 58.10

March 9, 2021 11:13 am | By Autochartist

Approaching Support level of 58.10 identified at 08-Mar-2021 16:00 EST Read more →

  • About Us
  • Privacy Policy
  • Disclaimer
  • Terms and Conditions
  • Get started for FREE
  • Contact Us
Copyright © 2022 Autochartist.com. All rights reserved.
This site uses cookies: Find out more.