Verizon Communications Inc. (VZ) up to 56.70
![](https://trader.autochartist.com/wp-content/uploads/2021/03/TDUSStocksTA603ccc8bbb64736fd2418224.png)
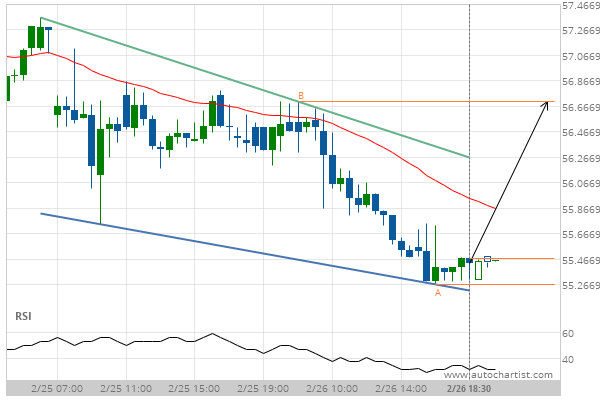
Falling Wedge identified at 26-Feb-2021 18:30 EST. This pattern is still in the process of forming. Possible bullish price movement towards the resistance 56.70 within the next 7 hours.