Verizon Communications Inc. (VZ) down to 53.02
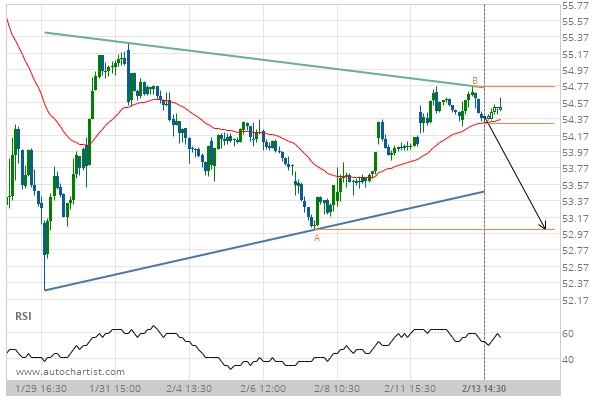
Triangle identified at 13-Feb-2019 14:30 EST. This pattern is still in the process of forming. Possible bearish price movement towards the support 53.02 within the next 20 hours.
Triangle identified at 13-Feb-2019 14:30 EST. This pattern is still in the process of forming. Possible bearish price movement towards the support 53.02 within the next 20 hours.