Verizon Communications Inc. (VZ) down to 52.01
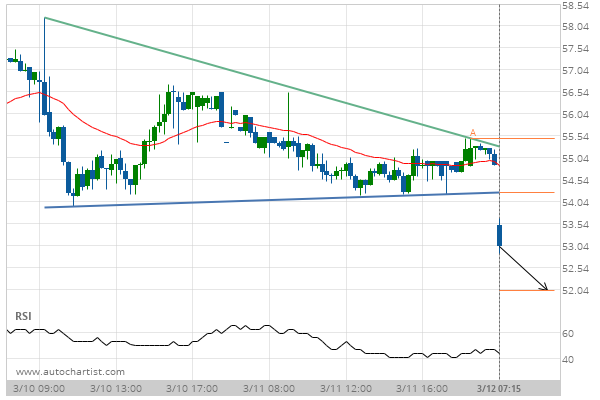
Descending Triangle has broken through the support line at 12-Mar-2020 07:15 EDT. Possible bearish price movement forecast for the next 19 hours towards 52.01.
Descending Triangle has broken through the support line at 12-Mar-2020 07:15 EDT. Possible bearish price movement forecast for the next 19 hours towards 52.01.