Verizon Communications Inc. (VZ) down to 49.13
![](https://trader.autochartist.com/wp-content/uploads/2020/03/TDUSStocksTA5e7b3e6532cb6a0cdebaeaaa.png)
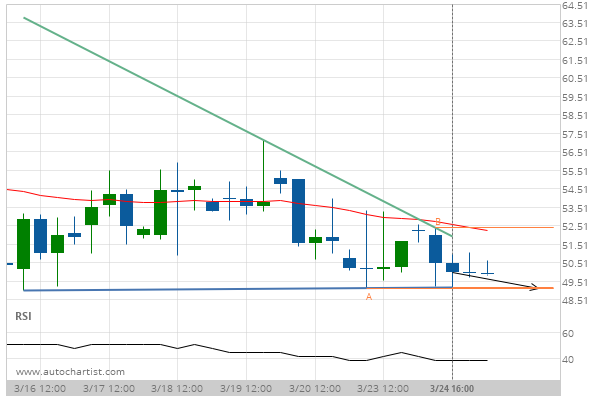
Descending Triangle identified at 24-Mar-2020 16:00 EDT. This pattern is still in the process of forming. Possible bearish price movement towards the support 49.13 within the next day.