Help & Documentation
  • Home
  • Sign In
  • Contact Us
  • Home
  • Sign In
  • Contact Us

USD/JPY down to 110.7900

/Forex Technical Analysis - TD/USD/JPY down to 110.7900

USD/JPY down to 110.7900

Posted on April 2, 2019 by admin wrote in Forex Technical Analysis - TD.

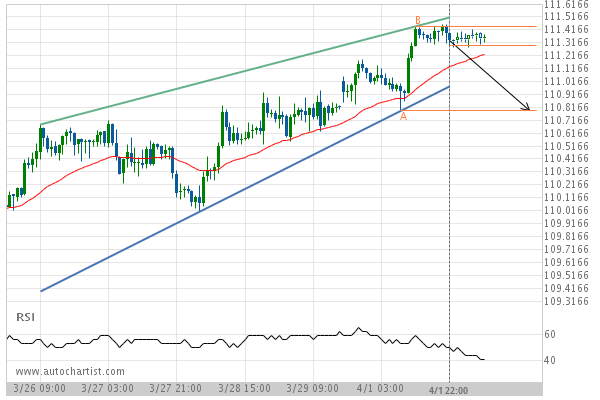
Rising Wedge identified at 01-Apr-2019 22:00 EDT. This pattern is still in the process of forming. Possible bearish price movement towards the support 110.7900 within the next 2 days.

Tags: USDJPY
0 Likes
420 Views

You may also like

XAU/USD up to 1290.6711
May 8, 2019
USD/CHF up to 0.9856
January 14, 2019
USD/CAD down to 1.3922
May 12, 2020

Comments are closed.

Corn down to 356.0000 EUR/NZD up to 1.6603

Forex Technical Analysis – TD

EUR/NZD down to 1.6797

January 15, 2021 11:13 am | By admin

Descending Triangle identified at 13-Jan-2021 16:00 EST. This pattern is... Read more →

AUD/USD down to 0.7690

January 15, 2021 11:13 am | By admin

Approaching Support level of 0.7690 identified at 15-Jan-2021 04:00 EST Read more →

GBP/CAD up to 1.7434

January 15, 2021 11:13 am | By admin

Ascending Triangle identified at 15-Jan-2021 00:00 EST. This pattern is... Read more →

GBP/USD down to 1.3606

January 15, 2021 11:13 am | By admin

Approaching Support level of 1.3606 identified at 15-Jan-2021 05:00 EST Read more →

USD/JPY down to 103.5570

January 15, 2021 11:13 am | By admin

Falling Wedge identified at 15-Jan-2021 06:00 EST. This pattern is... Read more →

  • About Us
  • Privacy Policy
  • Disclaimer
  • Terms and Conditions
  • Get started for FREE
  • Contact Us
Copyright © 2020 Autochartist.com. All rights reserved.
This site uses cookies: Find out more.