Help & Documentation
  • Home
  • Sign In
  • Contact Us
  • Home
  • Sign In
  • Contact Us

USD/CAD up to 1.2955

/Forex Technical Analysis - TD/USD/CAD up to 1.2955

USD/CAD up to 1.2955

Posted on September 24, 2018 by Autochartist wrote in Forex Technical Analysis - TD.

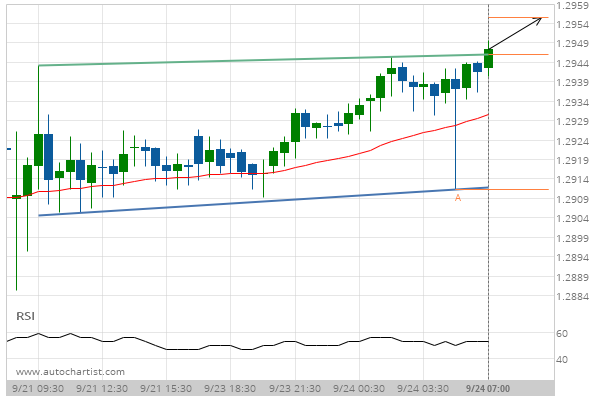
Ascending Triangle has broken through the resistance line at 24-Sep-2018 07:00 EDT. Possible bullish price movement forecast for the next 6 hours towards 1.2955.

Tags: USDCAD
0 Likes
1256 Views

You may also like

USD/CHF down to 0.9767
December 23, 2019
USD/JPY down to 106.9500
October 3, 2019
GBP/CHF down to 1.1596
September 22, 2020

Comments are closed.

Daily Forex Update: CHF/JPY EUR/USD up to 1.1803

Forex Technical Analysis – TD

EUR/CHF up to 1.1152

March 9, 2021 11:15 am | By Autochartist

Rising Wedge identified at 09-Mar-2021 00:00 EST. This pattern is... Read more →

EUR/JPY up to 129.6360

March 9, 2021 11:15 am | By Autochartist

Triangle identified at 08-Mar-2021 20:00 EST. This pattern is still... Read more →

NZD/USD up to 0.7188

March 9, 2021 11:15 am | By Autochartist

Broke through Resistance level of 0.7153 at 09-Mar-2021 04:00 EST Read more →

USD/JPY down to 108.1606

March 9, 2021 11:15 am | By Autochartist

Rising Wedge has broken through the support line at 09-Mar-2021... Read more →

USD/CHF down to 0.9284

March 9, 2021 11:15 am | By Autochartist

Approaching Support level of 0.9284 identified at 09-Mar-2021 05:15 EST Read more →

  • About Us
  • Privacy Policy
  • Disclaimer
  • Terms and Conditions
  • Get started for FREE
  • Contact Us
Copyright © 2022 Autochartist.com. All rights reserved.
This site uses cookies: Find out more.