Help & Documentation
  • Home
  • Sign In
  • Contact Us
  • Home
  • Sign In
  • Contact Us

US T-Bond up to 184.0590

/Futures Technical Analysis - TD/US T-Bond up to 184.0590

US T-Bond up to 184.0590

Posted on March 23, 2020 by Autochartist wrote in Futures Technical Analysis - TD.

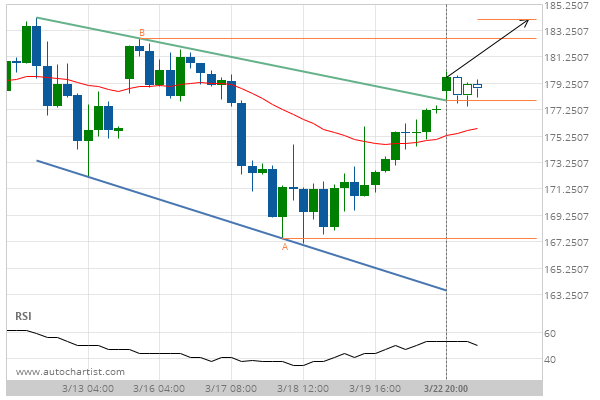
Channel Down has broken through the resistance line at 22-Mar-2020 20:00 EDT. Possible bullish price movement forecast for the next 2 days towards 184.0590.

Tags: CBOT, ZB
0 Likes
646 Views

You may also like

10 year T-Note down to 130.1713
August 19, 2019
Gold Front Month down to 1473.3480
December 4, 2019
Soybean Meal up to 323.3000
January 9, 2019

Comments are closed.

Silver Front Month up to 13.0950 Lean Hogs up to 66.1366

Futures Technical Analysis – TD

Light Sweet Crude Oil Front Month up to 67.9800

March 9, 2021 11:17 am | By Autochartist

Rising Wedge identified at 09-Mar-2021 05:00 EST. This pattern is... Read more →

Feeder Cattle Front Month down to 137.2250

March 9, 2021 11:17 am | By Autochartist

Channel Down identified at 08-Mar-2021 14:00 EST. This pattern is... Read more →

Soybean Oil up to 53.2300

March 9, 2021 11:17 am | By Autochartist

Channel Up identified at 09-Mar-2021 04:30 EST. This pattern is... Read more →

Silver Front Month up to 26.5600

March 9, 2021 11:17 am | By Autochartist

Approaching Resistance level of 26.5600 identified at 09-Mar-2021 04:00 EST Read more →

10 year T-Note up to 133.1644

March 9, 2021 11:17 am | By Autochartist

Falling Wedge has broken through the resistance line at 09-Mar-2021... Read more →

  • About Us
  • Privacy Policy
  • Disclaimer
  • Terms and Conditions
  • Get started for FREE
  • Contact Us
Copyright © 2022 Autochartist.com. All rights reserved.
This site uses cookies: Find out more.