Help & Documentation
  • Home
  • Sign In
  • Contact Us
  • Home
  • Sign In
  • Contact Us

US T-Bond up to 181.5938

/Futures Technical Analysis - TD/US T-Bond up to 181.5938

US T-Bond up to 181.5938

Posted on March 20, 2020 by admin wrote in Futures Technical Analysis - TD.

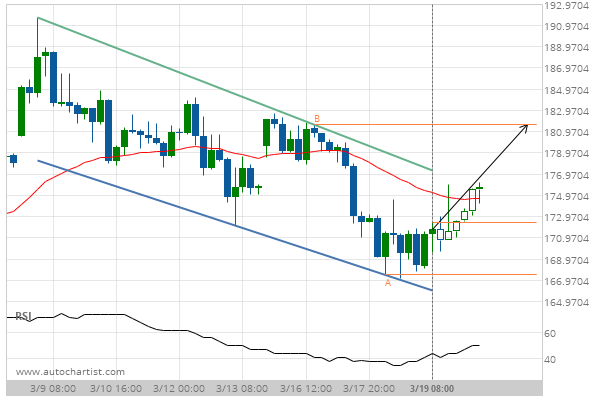
Channel Down identified at 19-Mar-2020 08:00 EDT. This pattern is still in the process of forming. Possible bullish price movement towards the resistance 181.5938 within the next 2 days.

Tags: CBOT, ZB
0 Likes
225 Views

You may also like

Soybean Oil down to 31.0900
August 25, 2020
US T-Bond down to 163.9679
September 5, 2019
10 year T-Note down to 128.0313
December 30, 2019

Comments are closed.

Corn up to 356.2500 EUR/CAD excessive bearish movement

Futures Technical Analysis – TD

Soybeans up to 1412.0000

January 21, 2021 1:08 pm | By admin

Approaching Resistance level of 1412.0000 identified at 21-Jan-2021 07:30 EST Read more →

Corn up to 541.5000

January 21, 2021 1:08 pm | By admin

Channel Up identified at 21-Jan-2021 00:00 EST. This pattern is... Read more →

Silver Front Month up to 26.4760

January 21, 2021 1:08 pm | By admin

Broke through Resistance level of 25.8650 at 20-Jan-2021 22:00 EST Read more →

Soybean Meal up to 447.6000

January 21, 2021 1:08 pm | By admin

Approaching Resistance level of 447.6000 identified at 21-Jan-2021 08:00 EST Read more →

10 year T-Note down to 136.6719

January 21, 2021 1:08 pm | By admin

Rising Wedge identified at 21-Jan-2021 06:00 EST. This pattern is... Read more →

  • About Us
  • Privacy Policy
  • Disclaimer
  • Terms and Conditions
  • Get started for FREE
  • Contact Us
Copyright © 2020 Autochartist.com. All rights reserved.
This site uses cookies: Find out more.