Help & Documentation
  • Home
  • Sign In
  • Contact Us
  • Home
  • Sign In
  • Contact Us

US T-Bond up to 179.4063

/Futures Technical Analysis - TD/US T-Bond up to 179.4063

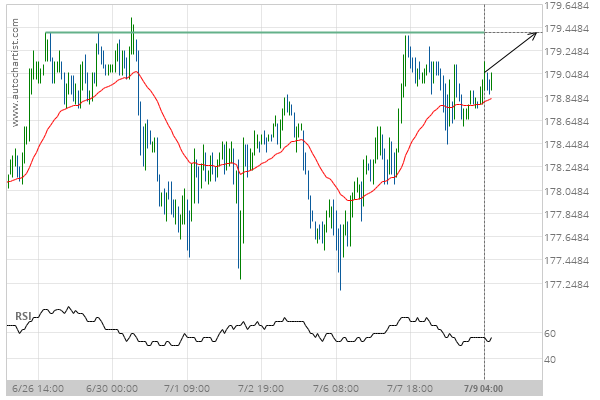
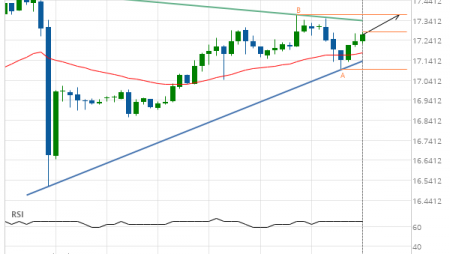
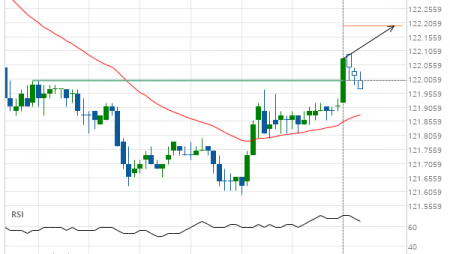
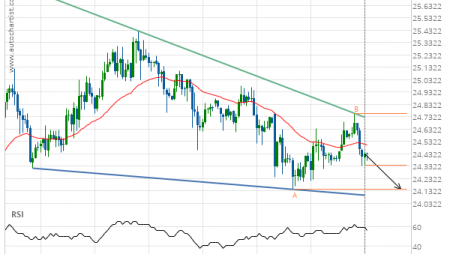
US T-Bond up to 179.4063

Posted on July 9, 2020 by Autochartist wrote in Futures Technical Analysis - TD.

Approaching Resistance level of 179.4063 identified at 09-Jul-2020 04:00 EDT

Tags: ZB
0 Likes
459 Views

You may also like

US T-Bond up to 172.8750
November 17, 2020
KC HRW Wheat down to 430.0000
December 12, 2019
Feeder Cattle Front Month up to 129.4500
October 30, 2020

Comments are closed.

10 year T-Note up to 139.2344 Soybeans up to 894.0000

Futures Technical Analysis – TD

Light Sweet Crude Oil Front Month up to 67.9800

March 9, 2021 11:17 am | By Autochartist

Rising Wedge identified at 09-Mar-2021 05:00 EST. This pattern is... Read more →

Feeder Cattle Front Month down to 137.2250

March 9, 2021 11:17 am | By Autochartist

Channel Down identified at 08-Mar-2021 14:00 EST. This pattern is... Read more →

Soybean Oil up to 53.2300

March 9, 2021 11:17 am | By Autochartist

Channel Up identified at 09-Mar-2021 04:30 EST. This pattern is... Read more →

Silver Front Month up to 26.5600

March 9, 2021 11:17 am | By Autochartist

Approaching Resistance level of 26.5600 identified at 09-Mar-2021 04:00 EST Read more →

10 year T-Note up to 133.1644

March 9, 2021 11:17 am | By Autochartist

Falling Wedge has broken through the resistance line at 09-Mar-2021... Read more →

  • About Us
  • Privacy Policy
  • Disclaimer
  • Terms and Conditions
  • Get started for FREE
  • Contact Us
Copyright © 2022 Autochartist.com. All rights reserved.
This site uses cookies: Find out more.