Help & Documentation
  • Home
  • Sign In
  • Contact Us
  • Home
  • Sign In
  • Contact Us

US T-Bond up to 163.1875

/Futures Technical Analysis - TD/US T-Bond up to 163.1875

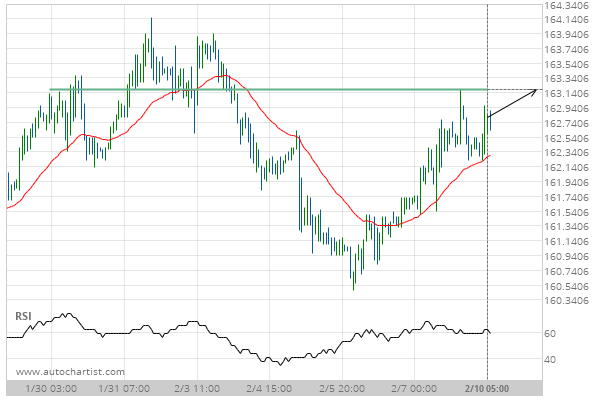
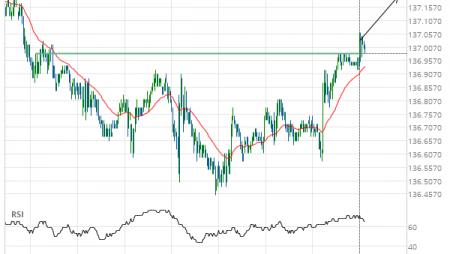
US T-Bond up to 163.1875

Posted on February 10, 2020 by Autochartist wrote in Futures Technical Analysis - TD.

Approaching Resistance level of 163.1875 identified at 10-Feb-2020 05:00 EST

Tags: ZB
0 Likes
686 Views

You may also like

Soybeans up to 1162.2500
November 17, 2020
Silver Front Month down to 15.1600
June 28, 2019
Corn down to 355.2500
April 12, 2019

Comments are closed.

10 year T-Note down to 130.2188 Silver Front Month up to 17.9204

Futures Technical Analysis – TD

Light Sweet Crude Oil Front Month up to 67.9800

March 9, 2021 11:17 am | By Autochartist

Rising Wedge identified at 09-Mar-2021 05:00 EST. This pattern is... Read more →

Feeder Cattle Front Month down to 137.2250

March 9, 2021 11:17 am | By Autochartist

Channel Down identified at 08-Mar-2021 14:00 EST. This pattern is... Read more →

Soybean Oil up to 53.2300

March 9, 2021 11:17 am | By Autochartist

Channel Up identified at 09-Mar-2021 04:30 EST. This pattern is... Read more →

Silver Front Month up to 26.5600

March 9, 2021 11:17 am | By Autochartist

Approaching Resistance level of 26.5600 identified at 09-Mar-2021 04:00 EST Read more →

10 year T-Note up to 133.1644

March 9, 2021 11:17 am | By Autochartist

Falling Wedge has broken through the resistance line at 09-Mar-2021... Read more →

  • About Us
  • Privacy Policy
  • Disclaimer
  • Terms and Conditions
  • Get started for FREE
  • Contact Us
Copyright © 2022 Autochartist.com. All rights reserved.
This site uses cookies: Find out more.