Help & Documentation
  • Home
  • Sign In
  • Contact Us
  • Home
  • Sign In
  • Contact Us

US T-Bond up to 159.9438

/Futures Technical Analysis - TD/US T-Bond up to 159.9438

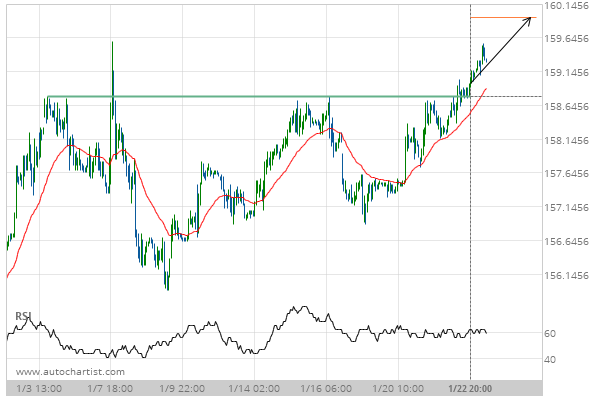
US T-Bond up to 159.9438

Posted on January 23, 2020 by Autochartist wrote in Futures Technical Analysis - TD.

Broke through Resistance level of 158.7813 at 22-Jan-2020 20:00 EST

Tags: ZB
0 Likes
700 Views

You may also like

Soybeans down to 1298.0000
January 28, 2021
Gold Front Month up to 1939.4000
October 16, 2020
10 year T-Note down to 129.1563
November 20, 2019

Comments are closed.

10 year T-Note down to 129.3750 USD/CHF up to 0.9729

Futures Technical Analysis – TD

Light Sweet Crude Oil Front Month up to 67.9800

March 9, 2021 11:17 am | By Autochartist

Rising Wedge identified at 09-Mar-2021 05:00 EST. This pattern is... Read more →

Feeder Cattle Front Month down to 137.2250

March 9, 2021 11:17 am | By Autochartist

Channel Down identified at 08-Mar-2021 14:00 EST. This pattern is... Read more →

Soybean Oil up to 53.2300

March 9, 2021 11:17 am | By Autochartist

Channel Up identified at 09-Mar-2021 04:30 EST. This pattern is... Read more →

Silver Front Month up to 26.5600

March 9, 2021 11:17 am | By Autochartist

Approaching Resistance level of 26.5600 identified at 09-Mar-2021 04:00 EST Read more →

10 year T-Note up to 133.1644

March 9, 2021 11:17 am | By Autochartist

Falling Wedge has broken through the resistance line at 09-Mar-2021... Read more →

  • About Us
  • Privacy Policy
  • Disclaimer
  • Terms and Conditions
  • Get started for FREE
  • Contact Us
Copyright © 2022 Autochartist.com. All rights reserved.
This site uses cookies: Find out more.