Help & Documentation
  • Home
  • Sign In
  • Contact Us
  • Home
  • Sign In
  • Contact Us

US T-Bond up to 158.7813

/Futures Technical Analysis - TD/US T-Bond up to 158.7813

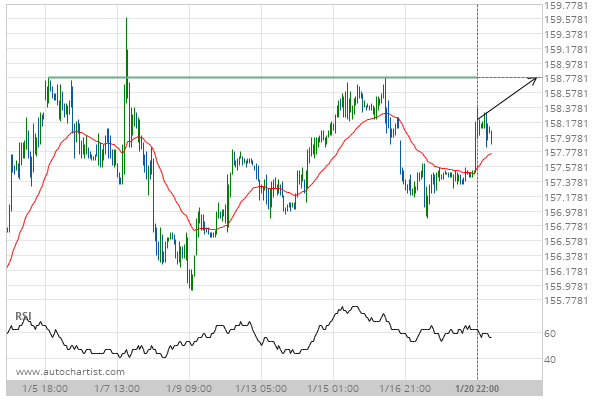
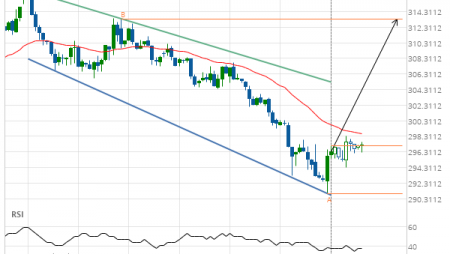
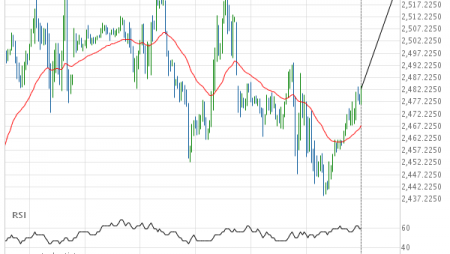
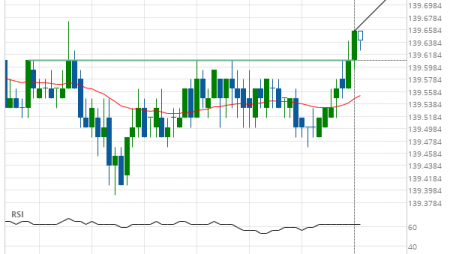
US T-Bond up to 158.7813

Posted on January 21, 2020 by Autochartist wrote in Futures Technical Analysis - TD.

Approaching Resistance level of 158.7813 identified at 20-Jan-2020 22:00 EST

Tags: ZB
0 Likes
545 Views

You may also like

Corn down to 530.0000
February 1, 2021
KC HRW Wheat down to 633.2500
March 1, 2021
Corn down to 379.0000
January 10, 2019

Comments are closed.

Light Sweet Crude Oil Front Month up to 58.8500 Soybean Meal down to 299.0000

Futures Technical Analysis – TD

Light Sweet Crude Oil Front Month up to 67.9800

March 9, 2021 11:17 am | By Autochartist

Rising Wedge identified at 09-Mar-2021 05:00 EST. This pattern is... Read more →

Feeder Cattle Front Month down to 137.2250

March 9, 2021 11:17 am | By Autochartist

Channel Down identified at 08-Mar-2021 14:00 EST. This pattern is... Read more →

Soybean Oil up to 53.2300

March 9, 2021 11:17 am | By Autochartist

Channel Up identified at 09-Mar-2021 04:30 EST. This pattern is... Read more →

Silver Front Month up to 26.5600

March 9, 2021 11:17 am | By Autochartist

Approaching Resistance level of 26.5600 identified at 09-Mar-2021 04:00 EST Read more →

10 year T-Note up to 133.1644

March 9, 2021 11:17 am | By Autochartist

Falling Wedge has broken through the resistance line at 09-Mar-2021... Read more →

  • About Us
  • Privacy Policy
  • Disclaimer
  • Terms and Conditions
  • Get started for FREE
  • Contact Us
Copyright © 2022 Autochartist.com. All rights reserved.
This site uses cookies: Find out more.