US T-Bond up to 146.9688
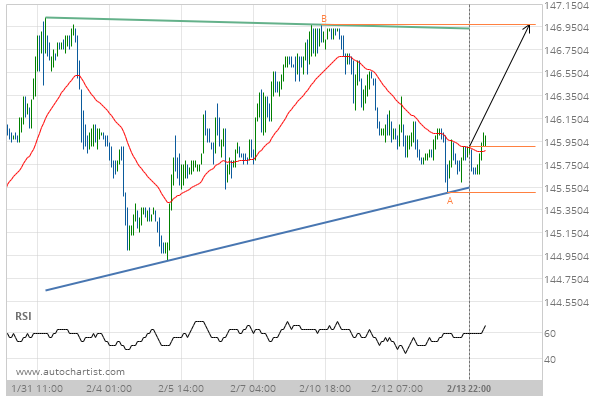
Ascending Triangle identified at 13-Feb-2019 22:00 EST. This pattern is still in the process of forming. Possible bullish price movement towards the resistance 146.9688 within the next 3 days.
Ascending Triangle identified at 13-Feb-2019 22:00 EST. This pattern is still in the process of forming. Possible bullish price movement towards the resistance 146.9688 within the next 3 days.