Help & Documentation
  • Home
  • Sign In
  • Contact Us
  • Home
  • Sign In
  • Contact Us

US T-Bond up to 146.6250

/Futures Technical Analysis - TD/US T-Bond up to 146.6250

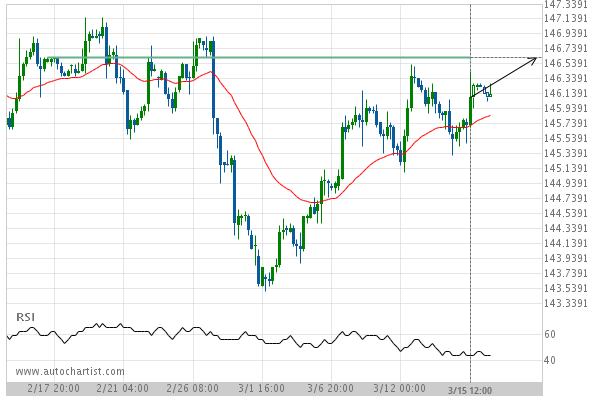
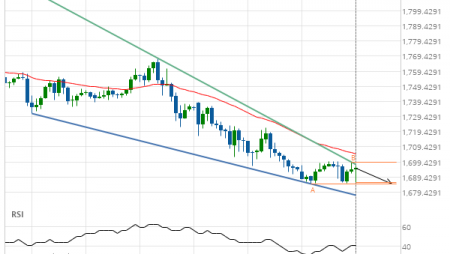
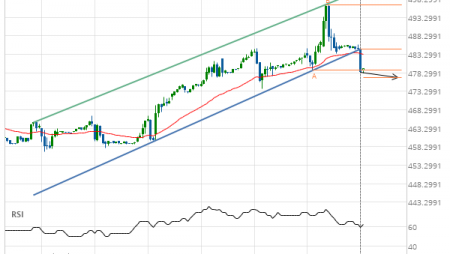
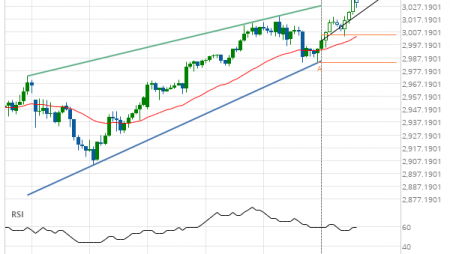
US T-Bond up to 146.6250

Posted on March 18, 2019 by Autochartist wrote in Futures Technical Analysis - TD.

Approaching Resistance level of 146.6250 identified at 15-Mar-2019 12:00 EDT

Tags: ZB
0 Likes
693 Views

You may also like

E-mini S&P 500 up to 2899.9250
June 13, 2019
Silver Front Month down to 17.6600
June 9, 2020
Lean Hogs up to 71.5750
December 3, 2020

Comments are closed.

Silver Front Month up to 15.3900 10 year T-Note up to 123.1094

Futures Technical Analysis – TD

Light Sweet Crude Oil Front Month up to 67.9800

March 9, 2021 11:17 am | By Autochartist

Rising Wedge identified at 09-Mar-2021 05:00 EST. This pattern is... Read more →

Feeder Cattle Front Month down to 137.2250

March 9, 2021 11:17 am | By Autochartist

Channel Down identified at 08-Mar-2021 14:00 EST. This pattern is... Read more →

Soybean Oil up to 53.2300

March 9, 2021 11:17 am | By Autochartist

Channel Up identified at 09-Mar-2021 04:30 EST. This pattern is... Read more →

Silver Front Month up to 26.5600

March 9, 2021 11:17 am | By Autochartist

Approaching Resistance level of 26.5600 identified at 09-Mar-2021 04:00 EST Read more →

10 year T-Note up to 133.1644

March 9, 2021 11:17 am | By Autochartist

Falling Wedge has broken through the resistance line at 09-Mar-2021... Read more →

  • About Us
  • Privacy Policy
  • Disclaimer
  • Terms and Conditions
  • Get started for FREE
  • Contact Us
Copyright © 2020 Autochartist.com. All rights reserved.
This site uses cookies: Find out more.