Help & Documentation
  • Home
  • Sign In
  • Contact Us
  • Home
  • Sign In
  • Contact Us

US T-Bond up to 140.7983

/Futures Technical Analysis - TD/US T-Bond up to 140.7983

US T-Bond up to 140.7983

Posted on September 19, 2018 by Autochartist wrote in Futures Technical Analysis - TD.

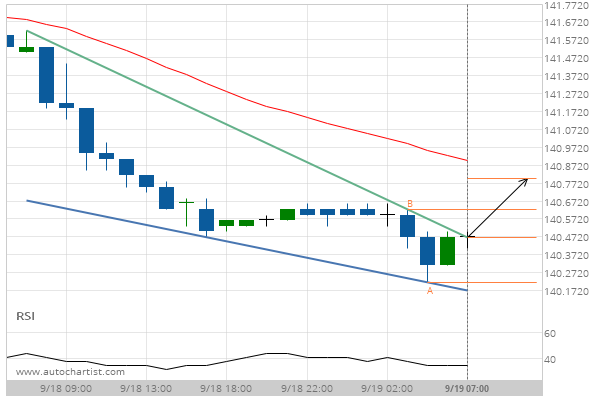
Pennant has broken through the resistance line at 19-Sep-2018 07:00 EDT. Possible bullish price movement forecast for the next 6 hours towards 140.7983.

Tags: CBOT, ZB
0 Likes
1220 Views

You may also like

Soybean Oil up to 32.7100
December 13, 2019
10 year T-Note down to 138.7344
July 6, 2020
E-mini S&P 500 up to 3344.0000
August 11, 2020

Comments are closed.

Gold Front Month up to 1214.2255 Light Sweet Crude Oil Front Month up to 71.2600

Futures Technical Analysis – TD

Light Sweet Crude Oil Front Month up to 67.9800

March 9, 2021 11:17 am | By Autochartist

Rising Wedge identified at 09-Mar-2021 05:00 EST. This pattern is... Read more →

Feeder Cattle Front Month down to 137.2250

March 9, 2021 11:17 am | By Autochartist

Channel Down identified at 08-Mar-2021 14:00 EST. This pattern is... Read more →

Soybean Oil up to 53.2300

March 9, 2021 11:17 am | By Autochartist

Channel Up identified at 09-Mar-2021 04:30 EST. This pattern is... Read more →

Silver Front Month up to 26.5600

March 9, 2021 11:17 am | By Autochartist

Approaching Resistance level of 26.5600 identified at 09-Mar-2021 04:00 EST Read more →

10 year T-Note up to 133.1644

March 9, 2021 11:17 am | By Autochartist

Falling Wedge has broken through the resistance line at 09-Mar-2021... Read more →

  • About Us
  • Privacy Policy
  • Disclaimer
  • Terms and Conditions
  • Get started for FREE
  • Contact Us
Copyright © 2020 Autochartist.com. All rights reserved.
This site uses cookies: Find out more.