Help & Documentation
  • Home
  • Sign In
  • Contact Us
  • Home
  • Sign In
  • Contact Us

US T-Bond excessive bearish movement

/Futures Statistical Analysis - TD/US T-Bond excessive bearish movement

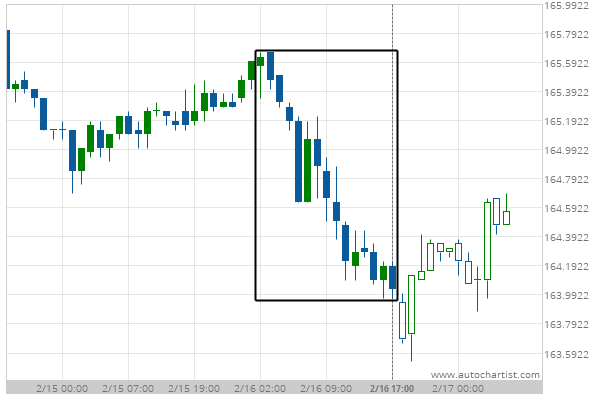
US T-Bond excessive bearish movement

Posted on February 17, 2021 by admin wrote in Futures Statistical Analysis - TD.

US T-Bond experienced a 0.96% bearish movement in the last 15 hours.

Tags: Big Movement, ZB
0 Likes
29 Views

You may also like

10 year T-Note excessive bearish movement
June 29, 2020
Light Sweet Crude Oil Front Month excessive bearish movement
April 23, 2020
KC HRW Wheat excessive bearish movement
December 9, 2019

Comments are closed.

10 year T-Note excessive bearish movement AUD/USD down to 0.7727

Futures Statistical Analysis – TD

Silver Front Month excessive bearish movement

February 26, 2021 11:13 am | By admin

Silver Front Month experienced a 5% bearish movement in the... Read more →

US T-Bond excessive bearish movement

February 26, 2021 11:13 am | By admin

US T-Bond experienced a 1.7% bearish movement in the last... Read more →

10 year T-Note excessive bearish movement

February 25, 2021 11:17 am | By admin

10 year T-Note experienced a 0.36% bearish movement in the... Read more →

Lean Hogs excessive bearish movement

February 25, 2021 11:17 am | By admin

Lean Hogs experienced a 34.63% bullish movement in the last... Read more →

US T-Bond excessive bearish movement

February 24, 2021 11:18 am | By admin

US T-Bond experienced a 4.23% bearish movement in the last... Read more →

  • About Us
  • Privacy Policy
  • Disclaimer
  • Terms and Conditions
  • Get started for FREE
  • Contact Us
Copyright © 2020 Autochartist.com. All rights reserved.
This site uses cookies: Find out more.