Help & Documentation
  • Home
  • Sign In
  • Contact Us
  • Home
  • Sign In
  • Contact Us

US T-Bond down to 185.7770

/Futures Technical Analysis - TD/US T-Bond down to 185.7770

US T-Bond down to 185.7770

Posted on March 9, 2020 by Autochartist wrote in Futures Technical Analysis - TD.

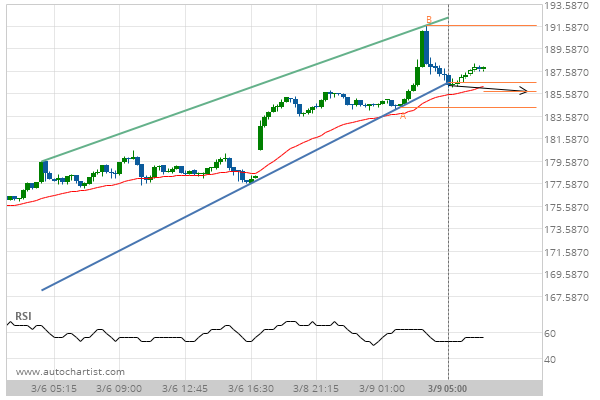
Rising Wedge has broken through the support line at 09-Mar-2020 05:00 EDT. Possible bearish price movement forecast for the next 6 hours towards 185.7770.

Tags: CBOT, ZB
0 Likes
456 Views

You may also like

10 year T-Note down to 121.6250
March 6, 2019
Lean Hogs up to 99.8250
April 16, 2019
KC HRW Wheat down to 450.2500
June 5, 2020

Comments are closed.

Feeder Cattle Front Month down to 126.9425 General Electric Co. (GE) down to 9.21

Futures Technical Analysis – TD

Light Sweet Crude Oil Front Month up to 67.9800

March 9, 2021 11:17 am | By Autochartist

Rising Wedge identified at 09-Mar-2021 05:00 EST. This pattern is... Read more →

Feeder Cattle Front Month down to 137.2250

March 9, 2021 11:17 am | By Autochartist

Channel Down identified at 08-Mar-2021 14:00 EST. This pattern is... Read more →

Soybean Oil up to 53.2300

March 9, 2021 11:17 am | By Autochartist

Channel Up identified at 09-Mar-2021 04:30 EST. This pattern is... Read more →

Silver Front Month up to 26.5600

March 9, 2021 11:17 am | By Autochartist

Approaching Resistance level of 26.5600 identified at 09-Mar-2021 04:00 EST Read more →

10 year T-Note up to 133.1644

March 9, 2021 11:17 am | By Autochartist

Falling Wedge has broken through the resistance line at 09-Mar-2021... Read more →

  • About Us
  • Privacy Policy
  • Disclaimer
  • Terms and Conditions
  • Get started for FREE
  • Contact Us
Copyright © 2020 Autochartist.com. All rights reserved.
This site uses cookies: Find out more.