Help & Documentation
  • Home
  • Sign In
  • Contact Us
  • Home
  • Sign In
  • Contact Us

US T-Bond down to 177.1563

/Futures Technical Analysis - TD/US T-Bond down to 177.1563

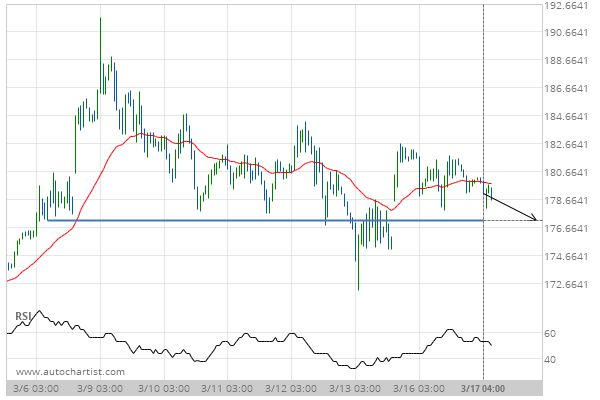
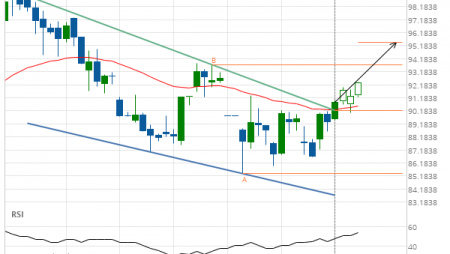
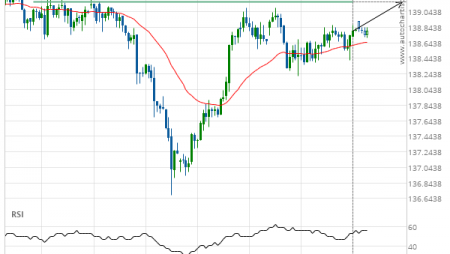
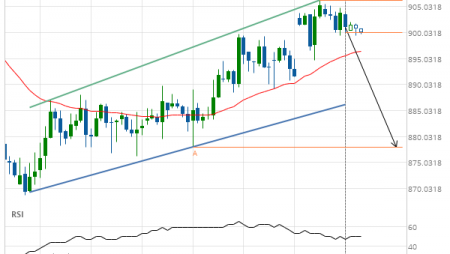
US T-Bond down to 177.1563

Posted on March 17, 2020 by admin wrote in Futures Technical Analysis - TD.

Approaching Support level of 177.1563 identified at 17-Mar-2020 04:00 EDT

Tags: ZB
0 Likes
203 Views

You may also like

Silver Front Month down to 18.1150
January 8, 2020
Soybean Oil up to 31.0800
February 20, 2020
Lean Hogs down to 59.5570
September 23, 2019

Comments are closed.

E-mini S&P 500 up to 2697.2500 Gold Front Month down to 1450.9000

Futures Technical Analysis – TD

Soybeans up to 1412.0000

January 21, 2021 1:08 pm | By admin

Approaching Resistance level of 1412.0000 identified at 21-Jan-2021 07:30 EST Read more →

Corn up to 541.5000

January 21, 2021 1:08 pm | By admin

Channel Up identified at 21-Jan-2021 00:00 EST. This pattern is... Read more →

Silver Front Month up to 26.4760

January 21, 2021 1:08 pm | By admin

Broke through Resistance level of 25.8650 at 20-Jan-2021 22:00 EST Read more →

Soybean Meal up to 447.6000

January 21, 2021 1:08 pm | By admin

Approaching Resistance level of 447.6000 identified at 21-Jan-2021 08:00 EST Read more →

10 year T-Note down to 136.6719

January 21, 2021 1:08 pm | By admin

Rising Wedge identified at 21-Jan-2021 06:00 EST. This pattern is... Read more →

  • About Us
  • Privacy Policy
  • Disclaimer
  • Terms and Conditions
  • Get started for FREE
  • Contact Us
Copyright © 2020 Autochartist.com. All rights reserved.
This site uses cookies: Find out more.