Help & Documentation
  • Home
  • Sign In
  • Contact Us
  • Home
  • Sign In
  • Contact Us

US T-Bond down to 175.3368

/Futures Technical Analysis - TD/US T-Bond down to 175.3368

US T-Bond down to 175.3368

Posted on October 1, 2020 by Autochartist wrote in Futures Technical Analysis - TD.

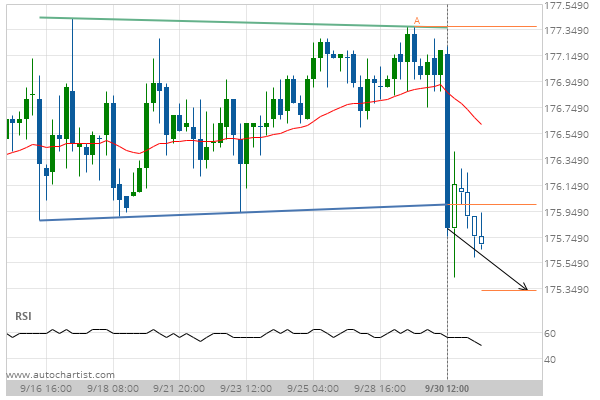
Rectangle has broken through the support line at 30-Sep-2020 12:00 EDT. Possible bearish price movement forecast for the next 2 days towards 175.3368.

Tags: CBOT-GBX, ZB
0 Likes
485 Views

You may also like

E-mini S&P 500 down to 2755.2500
April 17, 2020
E-mini S&P 500 down to 2901.0000
May 3, 2019
Soybean Meal down to 375.8000
December 15, 2020

Comments are closed.

Caterpillar Inc. (CAT) up to 150.95 Corn up to 382.7500

Futures Technical Analysis – TD

Light Sweet Crude Oil Front Month up to 67.9800

March 9, 2021 11:17 am | By Autochartist

Rising Wedge identified at 09-Mar-2021 05:00 EST. This pattern is... Read more →

Feeder Cattle Front Month down to 137.2250

March 9, 2021 11:17 am | By Autochartist

Channel Down identified at 08-Mar-2021 14:00 EST. This pattern is... Read more →

Soybean Oil up to 53.2300

March 9, 2021 11:17 am | By Autochartist

Channel Up identified at 09-Mar-2021 04:30 EST. This pattern is... Read more →

Silver Front Month up to 26.5600

March 9, 2021 11:17 am | By Autochartist

Approaching Resistance level of 26.5600 identified at 09-Mar-2021 04:00 EST Read more →

10 year T-Note up to 133.1644

March 9, 2021 11:17 am | By Autochartist

Falling Wedge has broken through the resistance line at 09-Mar-2021... Read more →

  • About Us
  • Privacy Policy
  • Disclaimer
  • Terms and Conditions
  • Get started for FREE
  • Contact Us
Copyright © 2022 Autochartist.com. All rights reserved.
This site uses cookies: Find out more.