Help & Documentation
  • Home
  • Sign In
  • Contact Us
  • Home
  • Sign In
  • Contact Us

US T-Bond down to 172.0625

/Futures Technical Analysis - TD/US T-Bond down to 172.0625

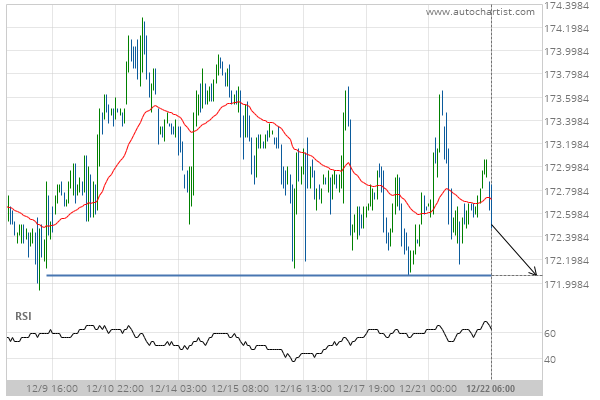
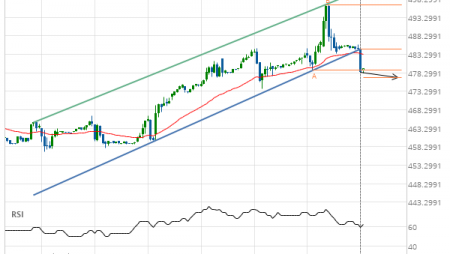
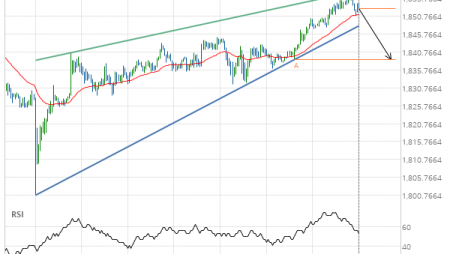
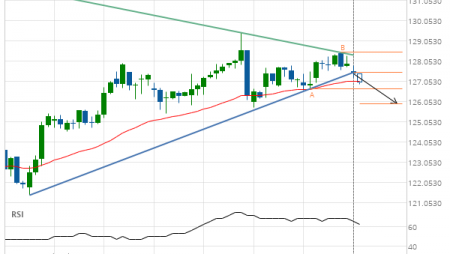
US T-Bond down to 172.0625

Posted on December 22, 2020 by Autochartist wrote in Futures Technical Analysis - TD.

Approaching Support level of 172.0625 identified at 22-Dec-2020 06:00 EST

Tags: ZB
0 Likes
249 Views

You may also like

Lean Hogs up to 63.5337
January 3, 2019
Soybean Oil up to 45.4300
January 28, 2021
Soybeans down to 1142.5000
December 8, 2020

Comments are closed.

10 year T-Note down to 137.7188 Silver Front Month down to 25.0100

Futures Technical Analysis – TD

Light Sweet Crude Oil Front Month up to 67.9800

March 9, 2021 11:17 am | By Autochartist

Rising Wedge identified at 09-Mar-2021 05:00 EST. This pattern is... Read more →

Feeder Cattle Front Month down to 137.2250

March 9, 2021 11:17 am | By Autochartist

Channel Down identified at 08-Mar-2021 14:00 EST. This pattern is... Read more →

Soybean Oil up to 53.2300

March 9, 2021 11:17 am | By Autochartist

Channel Up identified at 09-Mar-2021 04:30 EST. This pattern is... Read more →

Silver Front Month up to 26.5600

March 9, 2021 11:17 am | By Autochartist

Approaching Resistance level of 26.5600 identified at 09-Mar-2021 04:00 EST Read more →

10 year T-Note up to 133.1644

March 9, 2021 11:17 am | By Autochartist

Falling Wedge has broken through the resistance line at 09-Mar-2021... Read more →

  • About Us
  • Privacy Policy
  • Disclaimer
  • Terms and Conditions
  • Get started for FREE
  • Contact Us
Copyright © 2020 Autochartist.com. All rights reserved.
This site uses cookies: Find out more.