Help & Documentation
  • Home
  • Sign In
  • Contact Us
  • Home
  • Sign In
  • Contact Us

US T-Bond down to 168.4063

/Futures Technical Analysis - TD/US T-Bond down to 168.4063

US T-Bond down to 168.4063

Posted on February 2, 2021 by admin wrote in Futures Technical Analysis - TD.

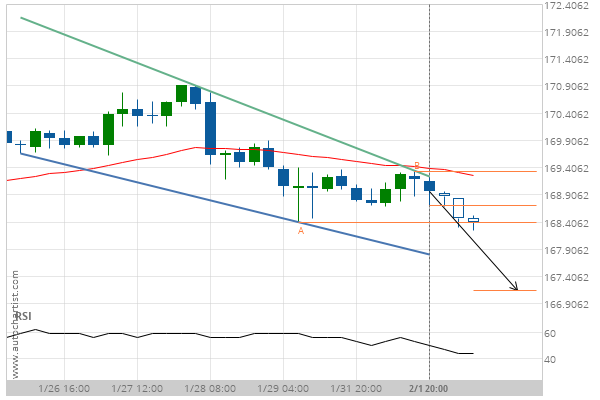
Falling Wedge identified at 01-Feb-2021 20:00 EST. This pattern is still in the process of forming. Possible bearish price movement towards the support 168.4063 within the next 24 hours.

Tags: CBOT-GBX, ZB
0 Likes
32 Views

You may also like

10 year T-Note down to 127.2656
July 8, 2019
Soybean Oil down to 27.5800
January 1, 2019
KC HRW Wheat down to 445.2500
May 31, 2019

Comments are closed.

GBP/CHF up to 1.2291 Light Sweet Crude Oil Front Month up to 54.3200

Futures Technical Analysis – TD

Soybean Meal up to 434.0000

March 4, 2021 11:14 am | By admin

Falling Wedge identified at 03-Mar-2021 04:00 EST. This pattern is... Read more →

Soybeans up to 1445.7500

March 4, 2021 11:14 am | By admin

Channel Up identified at 03-Mar-2021 00:00 EST. This pattern is... Read more →

Silver Front Month down to 25.4920

March 4, 2021 11:14 am | By admin

Broke through Support level of 26.0150 at 04-Mar-2021 04:30 EST Read more →

US T-Bond up to 159.9688

March 4, 2021 11:14 am | By admin

Triangle identified at 04-Mar-2021 03:00 EST. This pattern is still... Read more →

CORN MAY 2021 up to 558.0000

March 4, 2021 11:14 am | By admin

Triangle identified at 03-Mar-2021 04:00 EST. This pattern is still... Read more →

  • About Us
  • Privacy Policy
  • Disclaimer
  • Terms and Conditions
  • Get started for FREE
  • Contact Us
Copyright © 2020 Autochartist.com. All rights reserved.
This site uses cookies: Find out more.