Help & Documentation
  • Home
  • Sign In
  • Contact Us
  • Home
  • Sign In
  • Contact Us

US T-Bond down to 167.3500

/Futures Technical Analysis - TD/US T-Bond down to 167.3500

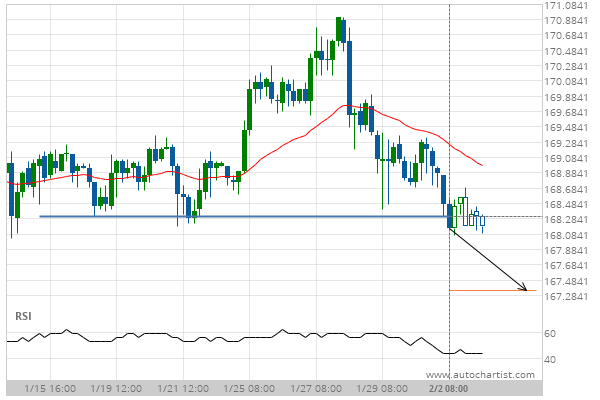
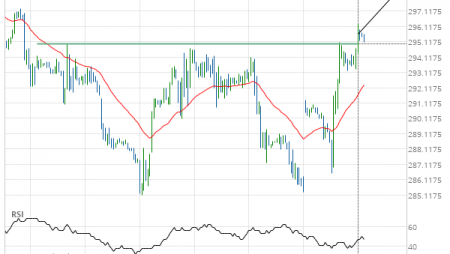
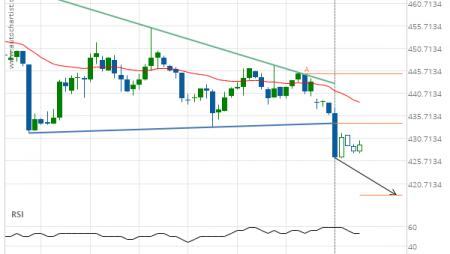
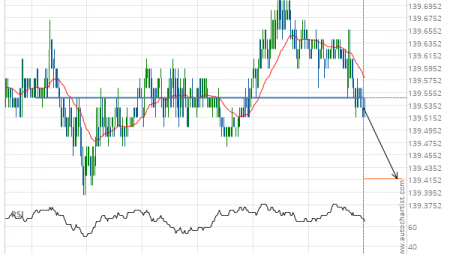
US T-Bond down to 167.3500

Posted on February 3, 2021 by admin wrote in Futures Technical Analysis - TD.

Broke through Support level of 168.3125 at 02-Feb-2021 08:00 EST

Tags: ZB
0 Likes
19 Views

You may also like

Soybean Oil up to 31.0800
February 20, 2020
Silver Front Month down to 14.6433
June 4, 2019
Lean Hogs down to 59.1250
January 23, 2019

Comments are closed.

Corn down to 492.5000 Gold Front Month down to 1830.4000

Futures Technical Analysis – TD

KC HRW Wheat down to 643.2500

February 26, 2021 11:15 am | By admin

Channel Down identified at 26-Feb-2021 04:00 EST. This pattern is... Read more →

Soybean Oil down to 49.0700

February 26, 2021 11:15 am | By admin

Falling Wedge identified at 26-Feb-2021 05:30 EST. This pattern is... Read more →

Soybeans down to 1365.0000

February 26, 2021 11:15 am | By admin

Approaching Support level of 1365.0000 identified at 25-Feb-2021 21:00 EST Read more →

Silver Front Month down to 26.5090

February 26, 2021 11:15 am | By admin

Broke through Support level of 27.2200 at 26-Feb-2021 01:00 EST Read more →

Light Sweet Crude Oil Front Month up to 63.6700

February 26, 2021 11:15 am | By admin

Rising Wedge identified at 26-Feb-2021 06:00 EST. This pattern is... Read more →

  • About Us
  • Privacy Policy
  • Disclaimer
  • Terms and Conditions
  • Get started for FREE
  • Contact Us
Copyright © 2020 Autochartist.com. All rights reserved.
This site uses cookies: Find out more.