Help & Documentation
  • Home
  • Sign In
  • Contact Us
  • Home
  • Sign In
  • Contact Us

US T-Bond down to 146.0938

/Futures Technical Analysis - TD/US T-Bond down to 146.0938

US T-Bond down to 146.0938

Posted on February 18, 2019 by Autochartist wrote in Futures Technical Analysis - TD.

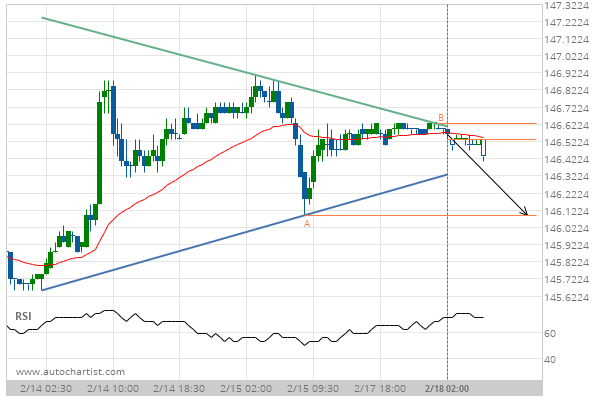
Triangle identified at 18-Feb-2019 02:00 EST. This pattern is still in the process of forming. Possible bearish price movement towards the support 146.0938 within the next 11 hours.

Tags: CBOT, ZB
0 Likes
870 Views

You may also like

US T-Bond down to 171.8750
December 14, 2020
Soybeans down to 896.3091
April 5, 2019
KC HRW Wheat up to 578.9000
November 25, 2020

Comments are closed.

Silver Front Month up to 15.9469 Feeder Cattle Front Month down to 143.4000

Futures Technical Analysis – TD

Light Sweet Crude Oil Front Month up to 67.9800

March 9, 2021 11:17 am | By Autochartist

Rising Wedge identified at 09-Mar-2021 05:00 EST. This pattern is... Read more →

Feeder Cattle Front Month down to 137.2250

March 9, 2021 11:17 am | By Autochartist

Channel Down identified at 08-Mar-2021 14:00 EST. This pattern is... Read more →

Soybean Oil up to 53.2300

March 9, 2021 11:17 am | By Autochartist

Channel Up identified at 09-Mar-2021 04:30 EST. This pattern is... Read more →

Silver Front Month up to 26.5600

March 9, 2021 11:17 am | By Autochartist

Approaching Resistance level of 26.5600 identified at 09-Mar-2021 04:00 EST Read more →

10 year T-Note up to 133.1644

March 9, 2021 11:17 am | By Autochartist

Falling Wedge has broken through the resistance line at 09-Mar-2021... Read more →

  • About Us
  • Privacy Policy
  • Disclaimer
  • Terms and Conditions
  • Get started for FREE
  • Contact Us
Copyright © 2022 Autochartist.com. All rights reserved.
This site uses cookies: Find out more.